Cohorte 2021
Trabajos finales
Trabajos finales utilizando Tableau o RMarkdown y ggplot2.
Concurso el gráfico más feo
Los gráficos están listados por orden alfabético
Agustín Osés
library(dplyr)
library(ggplot2)
library(readr)
library(tidyverse)
library(readxl)
library(datos)
library(png)
library(patchwork)

petroleo <- readPNG("datos/petroleo.png",native = TRUE)
torres <- readPNG("datos/torres.png",native = TRUE)

aviones_2 <- aviones %>%
  group_by(anio) %>%
  summarise(mean(asientos))

  colnames(aviones_2) <- c("anio", "promedio")

ggplot(aviones_2, aes(x=anio, y=promedio)) +
  theme_dark()+
  theme(plot.title = element_text(size = 15, colour = "brown", face = "italic"), plot.subtitle = element_text(size = 12, colour = "yellow", face = "italic"), plot.background = element_rect (fill = "violet"), plot.caption = element_text(size=9, color = "green"))+
  theme(panel.grid.major = element_line(color = "grey", size = 1, linetype = "dashed"))+
  theme(axis.title = element_text(colour = "orange", face = "italic", size = 20))+
  theme(axis.text.x = element_text(colour= "red", angle = 60,))+
  theme(axis.text.y = element_text(colour= "red", angle = -45,))+
  labs(x= "año", y = "asientos Promedio", title = "Cantidad Promedio de Asientos Por Avión Según Año de Fabricación", subtitle = "capacidad promedio de Aeronaves y su relación con hEchos históricos", caption = "fuente: paquete datos, DATASET Aviones, según registros de la FAA (Administración Federal de Aviación, EEUU") +
  geom_rect(aes(xmin=1956,xmax=1973,ymin=-0,ymax=250), fill="Brown", alpha=1)+
  geom_rect(aes(xmin=1973,xmax=2001,ymin=-0,ymax=250), fill="Yellow", alpha=1)+
  geom_rect(aes(xmin=2001,xmax=2013,ymin=-0,ymax=250), fill="Green", alpha=1)+
  geom_point(aes(size=promedio), colour="blue", shape=17)+
  geom_vline(aes(xintercept=1973), colour=1, size=3)+
  geom_vline(aes(xintercept=2001), colour=2, size=3)+
  geom_smooth(size=3, colour ="Grey")+
  inset_element (p= torres, left = 0.9, bottom = 0.15, right = 0.7, top = 0.50)+
  inset_element (p= petroleo, left = 0.25, bottom = 0.65, right = 0.40, top = 1)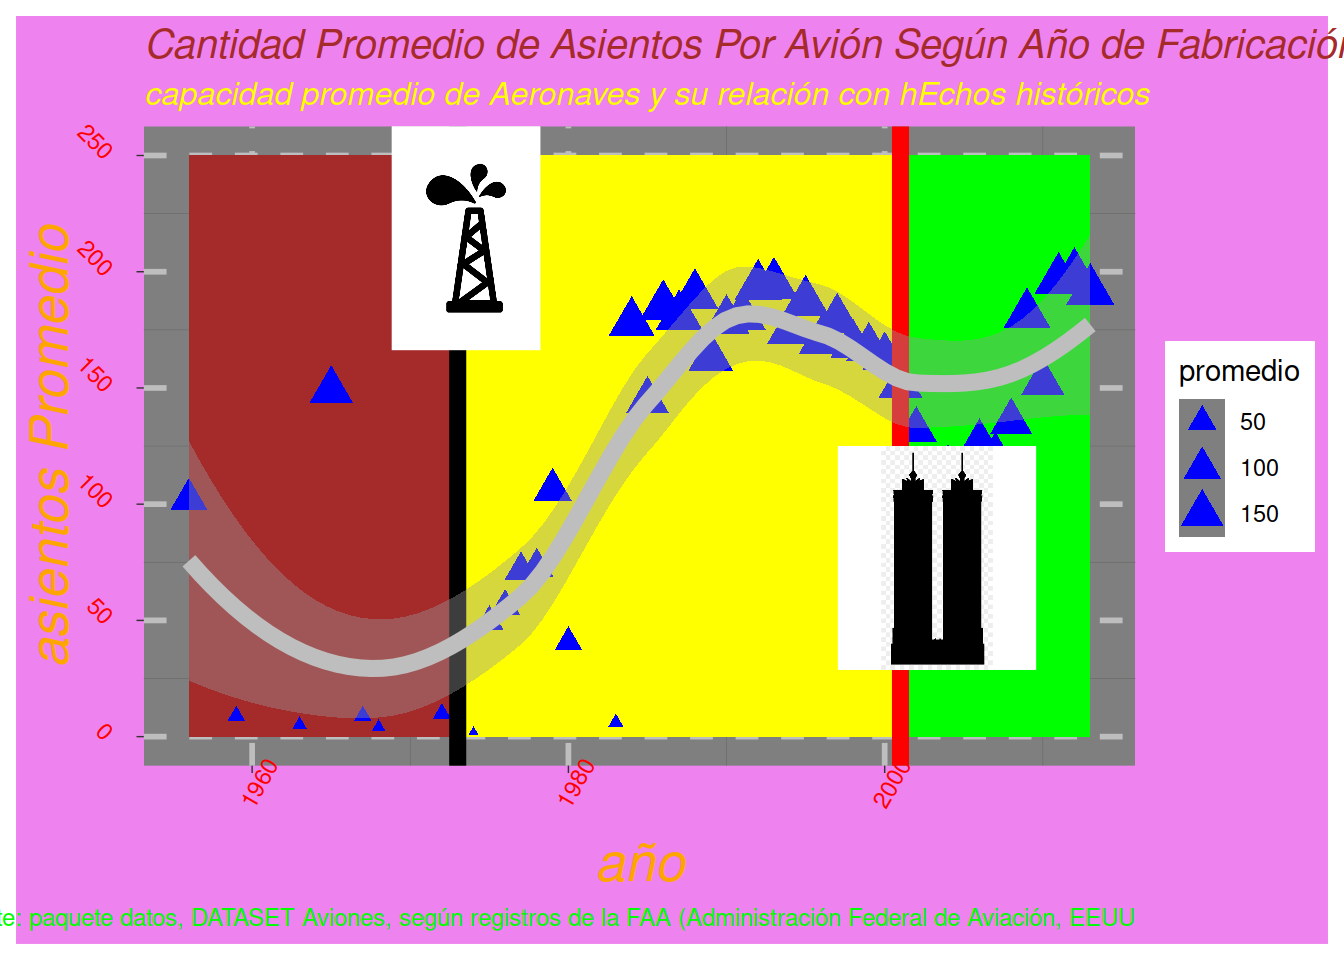
Alexander Sothmann
Gráfico enviado al concurso
library(tidyverse)
paises <-datos::paises

paises_filtrado <- filter(paises,anio>=2000 & anio<=2021)
ggplot(paises, aes(x = poblacion, y = esperanza_de_vida))+
  geom_point(aes(size = pib_per_capita))+
  scale_size_area(max_size = 15, guide = NULL) +
  scale_x_log10()+
  geom_smooth(method = "lm", se = FALSE, aes(color = anio))+
   facet_wrap(~continente)+
  labs(title = "Paises del mundo",
       subtitle = "Año 2000 a 2021",
       caption = "El tamaño de cada circulo representa el producto bruto interno por cada habitante.",
       x = "poblacion",
       y = "Life expectancy",
       color = "")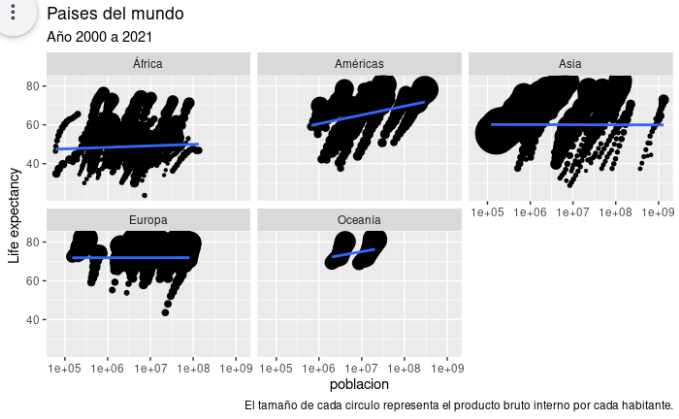
Gráfico 3D extra
library(scatterplot3d)
paises <-datos::paises

x <- paises$poblacion
y <- paises$esperanza_de_vida
z <- paises$anio

scatterplot3d(x, y, z, pch = 19, color = "blue")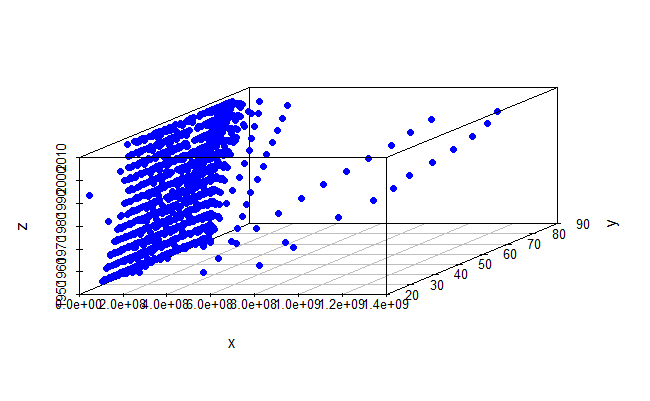
Ana Clara Suiffet
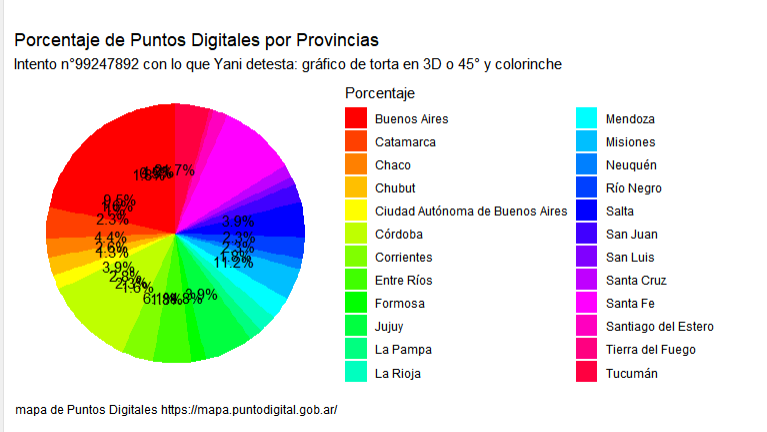
ggplot(provincia_porc, aes(x=1, y=percentage,fill=provincia)) +
  geom_bar(stat="identity") +
  scale_fill_manual(values=rainbow(24)) +
  geom_text(aes(label = paste0(round(percentage,1),"%")),
                  position = position_stack(vjust = 0,5)) +
  coord_polar(theta= "y") +
  theme_void()+
  labs(
    x = "Provincias Argentinas",
    y = "Porcentaje de Puntos Digitales",
    title="Porcentaje de Puntos Digitales por Provincias",
    subtitle = "Intento n°99247892 con lo que Yani detesta: gráfico de torta en 3D o 45° y colorinche",
    fill = "Porcentaje",
    caption = "Fuente: mapa de Puntos Digitales https://mapa.puntodigital.gob.ar/")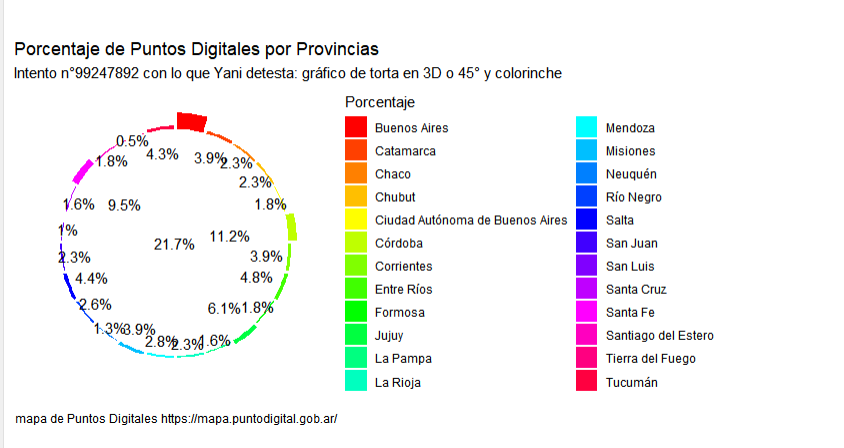
Analia Savino
expo_biodiesel <- expo_biodiesel %>%
  mutate(fecha_corregida = dmy(fecha))

expo_biodiesel <- expo_biodiesel %>%
  select(fecha_corregida, pais_destino, cantidad_ton, monto_fob) %>%
  mutate(ano = year(fecha_corregida))

exp_bio_limpio <- expo_biodiesel %>%
  group_by(pais_destino) %>%
  summarise(cant_ton =sum(cantidad_ton), monto = sum(monto_fob)) %>%
  ungroup() %>%
  filter(cant_ton <=15000)

ggplot(exp_bio_limpio) +
  geom_col(aes(x= pais_destino, y= cant_ton, fill=monto))+
  labs(title = "Paises a los que menos biodisel exporatmos",
       x="Paises",
       y= "Toneladas")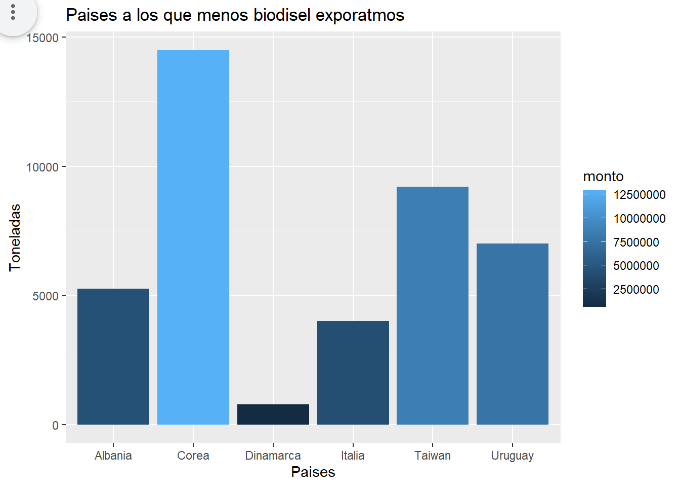
Bianca Vallejos
# Fuente de datos: cotizaciones extraidas de Ambito (https://www.ambito.com/contenidos/merval-historico.html)

grafico_1 <- ggplot(cotizacion, aes(fecha, precio_cierre, col = mes)) +
  geom_line() +
  geom_point() +
  theme(axis.title.x=element_blank(),
        axis.text.x=element_blank(),
        axis.ticks.x=element_blank(),
        panel.background = element_rect(fill="light green"),
        text=element_text(family="Comic Sans MS")) +
  labs(title = "Cotizacion diaria del MERVAL", subtitle = "Año 2021")
grafico_final <- ggdraw(grafico_1) +
  draw_image("https://i.pinimg.com/564x/44/a3/d1/44a3d17dea5ec11f27445fece8e137ba.jpg",
             scale = .43, x = 1, hjust = 1, halign = 0.135, valign = 0.12)
grafico_final

ggsave("grafico_final.jpg", width = 7, height = 4)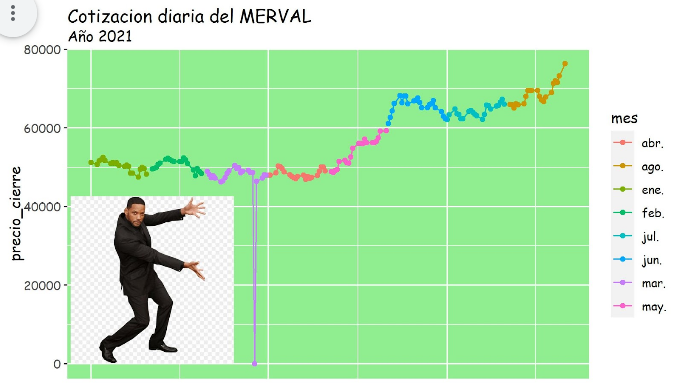
Erika Lucena
library(datos)
library(readr)
library(dplyr)
library(ggplot2)
library(png)
library(patchwork)

precio_mediana<- diamantes %>%
  summarise(precio_mediana= median(precio))

precio_max<- diamantes %>%
  summarise(precio_max= max(precio))


grafico_feo <- diamantes %>%
  ggplot()+
  geom_boxplot(aes(corte, precio, fill=corte))+
  geom_line(aes(quilate, precio, color=corte))+
  labs(title='¿El precio del corte "Ideal" puede ser menor al resto de los cortes?', subtitle="La mediana del precio para el corte de análisis es menor que en el resto de los cortes", caption= "Fuente:Base Diamantes de la librería Datos de R")+
  geom_hline(data=precio_mediana, aes(yintercept = precio_mediana), color="yellow", linetype=2)+
  geom_hline(data=precio_max, aes(yintercept = precio_max), color="yellow", linetype=2)+
  theme(text= element_text(color="red", face="bold"), plot.background = element_rect (fill = "pink"), panel.grid.major.x= element_line(size=1, color="red", linetype = "3313"), panel.grid.major.y=element_line(size=1, color="red", linetype = "dotdash"),  legend.background= element_blank(), panel.background= element_rect(fill="green"))+
  annotate('text', x = 4.5, y = precio_mediana$precio_mediana-500, label = "Mediana del Precio para todos los cortes", fontface = "bold", size=2, color="yellow")+
  annotate('text', x = 4, y = precio_max$precio_max+500, label = "Precio Máximo", color="yellow", fontface = "bold", size=2)

grafico_feo 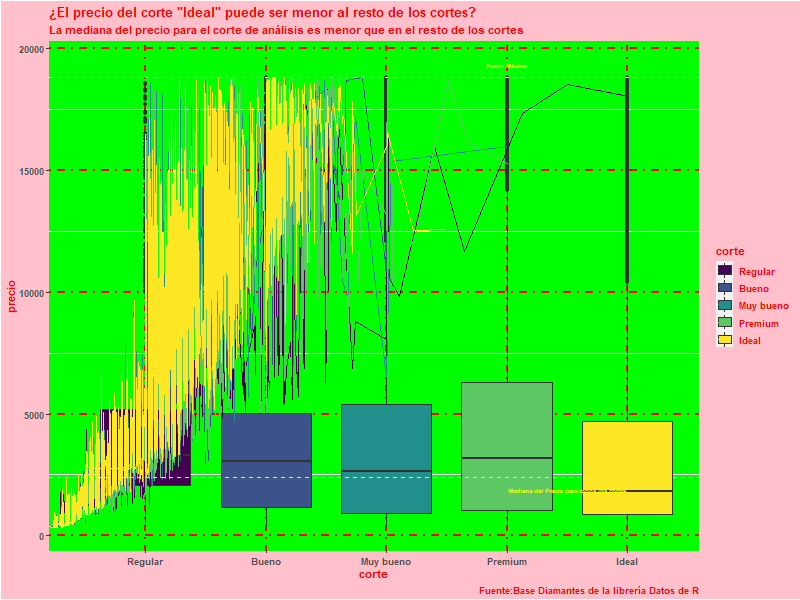
Facundo Monti
ggplot(empresas, aes(x = Categoria, y = Provincia)) +
  geom_point(aes(color = "Provincia"))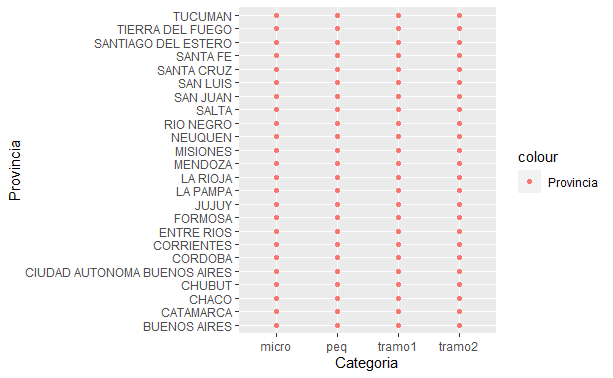
Federico Aramburu
library(tidyverse)
library(ggplot2)

# Homero
homero <- tibble (x= c(3.7,3.5,3.32,3.8,4.4,4.6,5.0,4.6,3.9,3.6,3.7,3.8,3.82,3.85,3.95,3.82,3.7,3.68,
                     3.69,3.75,3.82,3.97,3.82,3.75,3.53,3.49,3.52,3.69,3.89,4.2,4.4,4.75,4.9,5.25,5.5,
                     5.6,5.7,5.78,5.72,5.65,5.52,5.48,5.44,5.35,5.29,5.25,5.16,5.25,5.29,5.35,5.44,
                     5.48,5.52,5.65,5.72,5.76,5.80,5.85,5.86,5.82,5.72,5.71,5.45,5.25,5.45,5.7095,
                     5.77,5.755,5.75,5.65,5.78,5.9,5.75,5.5,5.37,5.25,4.95,4.79,4.6,4.65,4.6,4.48),
                  y= c(1.5,1.47,0.87,0.515,0.23,0.87,0.36,0.87,1.15,1.46,1.38,2,2.51,2.5088,2.5095,2.514,
                     2.56,2.63,2.85,2.9,2.94,2.90,2.94,2.9,3.65,4.05,4.56,5.1,5.30,5.50,5.55,5.53,5.48,
                     5.20,4.85,4.55,4.15,4,3.85,3.89,3.91,3.92,3.91,3.88,3.85,3.83,3.75,3.83,3.85,3.88,
                     3.91,3.92,3.91,3.89,3.85,3.81,3.74,3.65,3.48,3.32,3.18,3.175,3.19,3.20,3.19,3.174,
                     3.05,2.98,2.87,2.8,2.18,2,1.87,1.74,1.73,1.732,1.75,1.84,2,2.1,2,1.9))
#82 puntos

oreja <- tibble (a = c(3.75,3.80,3.90,3.80,3.75,3.72 ,rep(NA,76)),
                 b = c(2.65,2.75,2.83,2.75,2.83,2.81 ,rep(NA,76)),
                 m = c(3.5,3.52,3.75,3.85,4 ,rep(NA,77)),
                 p = c(2.98,3.40,3.08,3.50,3.12 ,rep(NA,77)))

boca <- tibble (bocax= c(5.16,5.45,5.70,5.77,5.755,5.75,5.65,5.50,5.40,5.25,4.8,4.65,4.45,4.32,4.23,
                         4.22,4.30,4.38,4.5,4.75,4.82,4.9,5.12,5.28,5.32,5.42,5.32,5.28,5.12,5.05,
                         5.10,5.13,5.2,5.23,5.20,5.52,5.08,5.52,5.50,5.52,5.40,5.19,5.28,rep(NA,39)),
                bocay= c(3.20,3.19,3.17,3.05,2.98,2.87,2.80,2.81,2.84,2.83,2.75,2.65,2.52,2.25,2.15,
                         1.84,1.68,1.47,1.25,1.18,1.16,1.19,1.3,1.475,1.53,1.71,1.53,1.475,1.3,1.10,
                         0.80,0.53,0.45,0.39,0.26,1.01,1.18,1.01,0.99,0.29,0.35,0.365,0.11,rep(NA,39)))

ojos <- tibble (ojox= 4.85,ojoy=3.465,ojox1=4.65,ojoy1=3.42,ojox2=5.4,ojoy2=3.42)


lata <- tibble (ll = c(8.5,8.6,9.6,9.5,rep(NA,78)),
                kk = c(5.5,4.0,4.0,5.5,rep(NA,78)),
                hh = c(8.53,8.58,9.55,9.5,rep(NA,78)),
                jj = c(5.2,4.55,4.59,5.24,rep(NA,78)))

homero %>%
  ggplot()+
  geom_path( aes (x, y),size = 0.5, col="blue2")+
  geom_point(aes(ojos$ojox,ojos$ojoy), size=19, pch=1, col="blue2")+
  geom_point(aes(ojos$ojox1,ojos$ojoy1), size = 2)+
  geom_point(aes(ojos$ojox2,ojos$ojoy2), size = 2)+
  geom_path( aes (x = oreja$a, y = oreja$b),col="blue2") +
  geom_path( aes (x = oreja$m, y = oreja$p),size=0.6, col= "blue2") +
  geom_path( aes (x = boca$bocax, y = boca$bocay),size=0.5, col= "blue2") +
  geom_curve(aes(x=4.85, y=5.50, xend=4.15, yend=5.16), size=0.5,
             color="blue3", curvature = 1.3)+
  geom_curve(aes(x=4.6, y=5.55, xend=3.9, yend=5), size=0.5,
             color="blue3", curvature = 1.3)+
  geom_polygon(aes(lata$ll,lata$kk), fill="red", col="grey4",size=0.5)+
  geom_polygon(aes(lata$hh,lata$jj), fill="white", col="grey4")+
  geom_curve(aes(x=8.57, y=3.98, xend=9.61, yend=4.02), size=1.5,
             color="darkgrey", curvature = 0.06)+
  geom_curve(aes(x=8.5, y=5.48, xend=9.51, yend=5.51), size=1.5,
             color="darkgrey", curvature = -0.04)+
  geom_text(x = 9, y = 4.9, label ="Duff",col="black",size= 7,angle=2.5)+
  geom_text(x = 9.1, y = 4.3, label ="BEER",col="black",size= 3.5,angle=2.5)+
  geom_point(aes(x=9.1,y=4.7), size= 50, pch=1)+
  geom_point(aes(x=7.3,y=5.4), size= 12, pch=1)+
  geom_point(aes(x=6.5,y=5.2), size= 8, pch=1)+
  geom_point(aes(x=5.9,y=5), size= 4, pch=1)+
  scale_x_continuous(limits = c(0,10), breaks = c(1,2,3,4,5,6,7,8,9,10))+
  scale_y_continuous(limits = c(0,6), breaks = c(1,2,3,4,5,6))+
  geom_text(x = 1.5, y = 3, label = "La cerveza es\nla causa y\nsolución\nde todos\nlos problemas",
            size=6, angle= 3,col="green2")+
  theme_void()

 ggsave(paste0("homero",".png"))

# ***"La cerveza es la causa y solución de todos los problemas"*** - **Homero Simpson**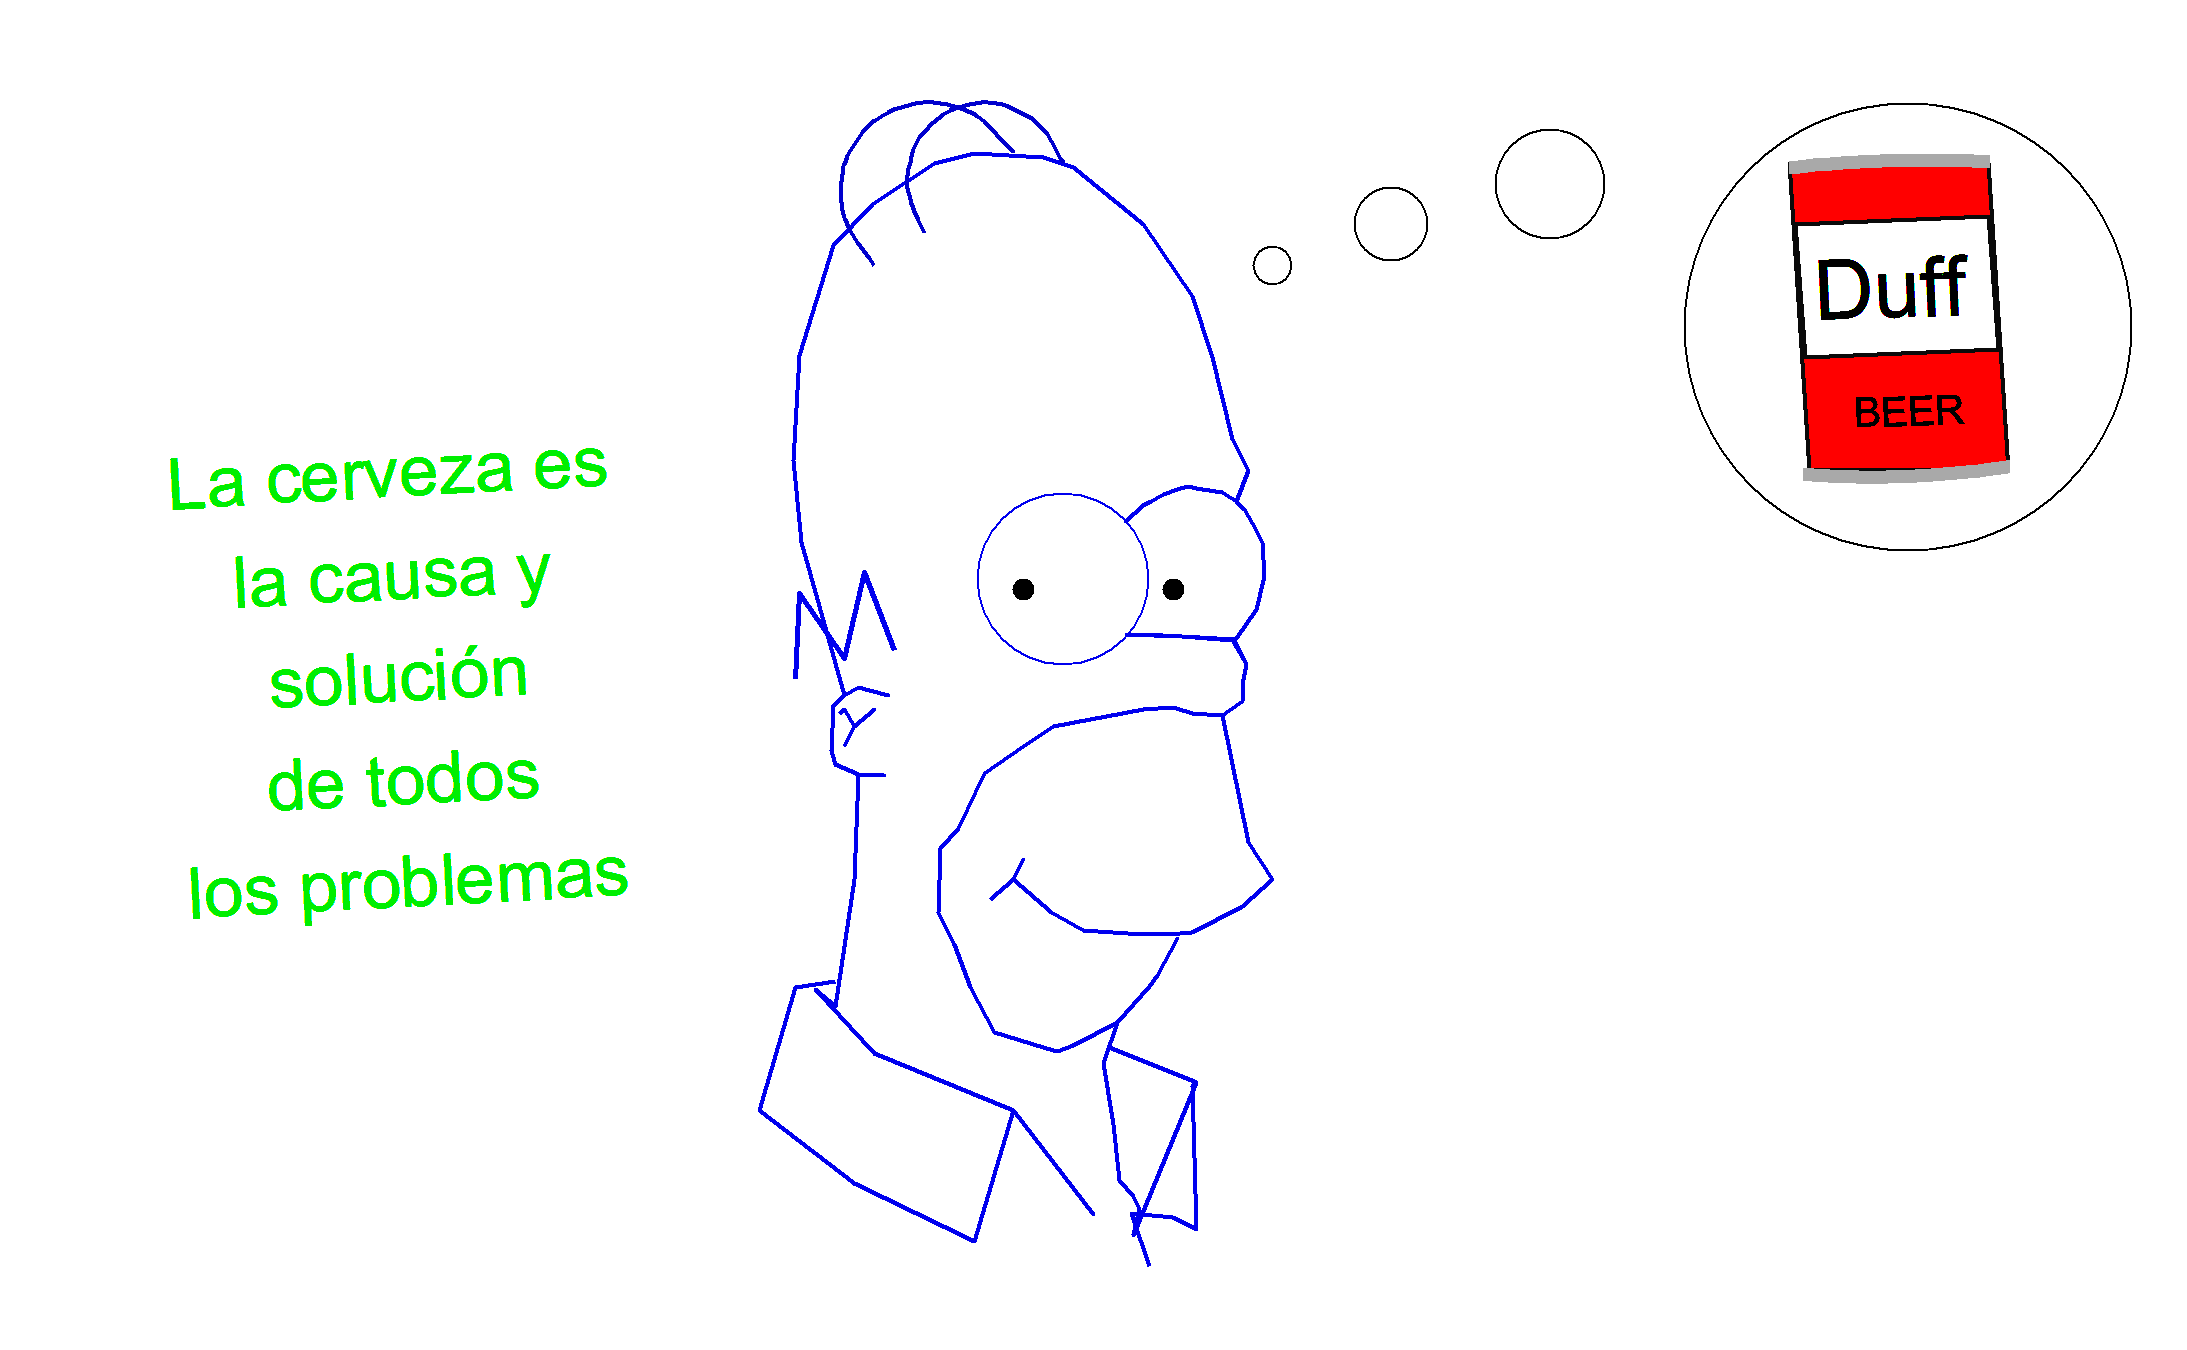
Federico Gonzalez
library(ggplot2)
library(babynames)
library(dplyr)
library(hrbrthemes)
library(viridis)

don <- babynames %>%
filter(name %in% c("Luke", "Christian", "Edward")) %>%
filter(sex=="M")

#Tips:
#No se entiende a que apunta el grafico, no se entiende que son las lineas, hay un solo color.
#No hay explicación anexa al grafico
#Mas horrible no se consigue

don %>%
ggplot( aes(x=year, y=n, group=name, color=name)) +
geom_line(color='black') +
ggtitle("Popularity of American names in the previous 30 years") +
ylab("Number of babies born")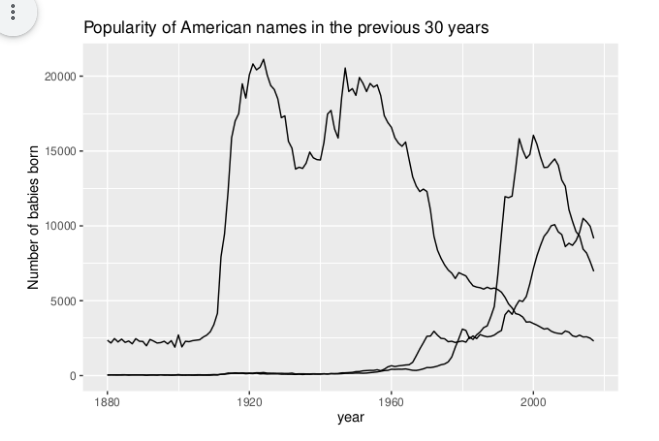
Federico Santoro
dia_max<-as.Date("2020-12-31")

prov %>%
    ggplot(aes(x = FIS, fill = Fallecido))+
    geom_histogram(binwidth = 30, color = "limegreen")+
    scale_x_date(date_breaks = "7 days", date_labels = "%W",expand = c(0,1))+
    scale_y_continuous(breaks = c(0,15,100,256,1032,2222,9876,15000,31000), labels = c(0,15,100,256,1032,2222,9876,15000,31000), limits = c(0,31000),expand = c(1,1))+
    labs( x = "Semana", y = "N.Casos", title = "Fallecidos en Chubut por Covid")+
    theme(legend.position = "left",
          legend.background = element_rect(fill = "magenta", colour = "yellow"),
          panel.background = element_rect(fill = "purple", colour = "black"),
          panel.grid.major.y = element_line(colour = "yellow"),
          plot.background = element_rect(fill = "#eaff00"),
          plot.title = element_text(size = rel(4)),
          axis.title.x = element_text(size = rel(1.5), angle = 60),
          axis.title.y = element_text(size = rel(1.5), angle = 60))+
  annotate(geom = "text", x = dia_max, y = 31000, label = "Maximo de muertos", fontface = "bold")+
  geom_curve(aes(x= dia_max, y = 27000, xend= dia_max, yend= 12000),
             curvature = -0.5,
             color = "red",
             arrow = arrow(length = unit(0.20, "inch")), size = 2)+
    geom_curve(aes(x= dia_max, y = 27000, xend= dia_max, yend= 12000),
             curvature = 0.5,
             color = "white",
             arrow = arrow(length = unit(0.20, "inch")), size = 2)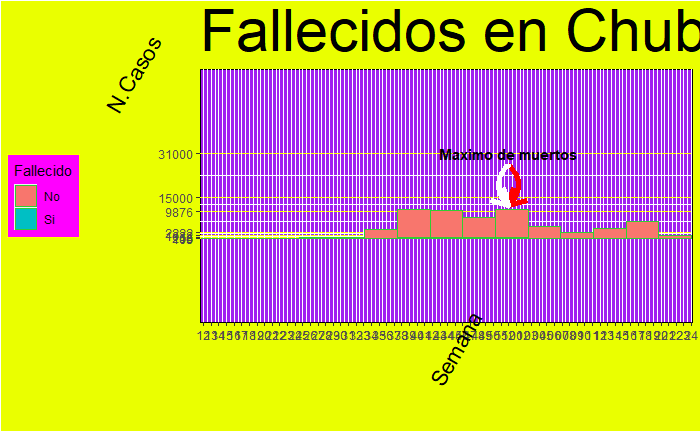
Hernan Costa
# Cargamos con el paquete EPH la base individual del IV trim 2020
ind_4_20 <- get_microdata(year=2020, trimester=4, type='individual')

# Gráfico del ingreso total individual por género
# Nota: la variable CH04 toma dos valores (1= varón ; 2=mujer)

ggplot(ind_4_20, aes(CODUSU, P47T, color = CH04)) +
  geom_col(na.rm = TRUE)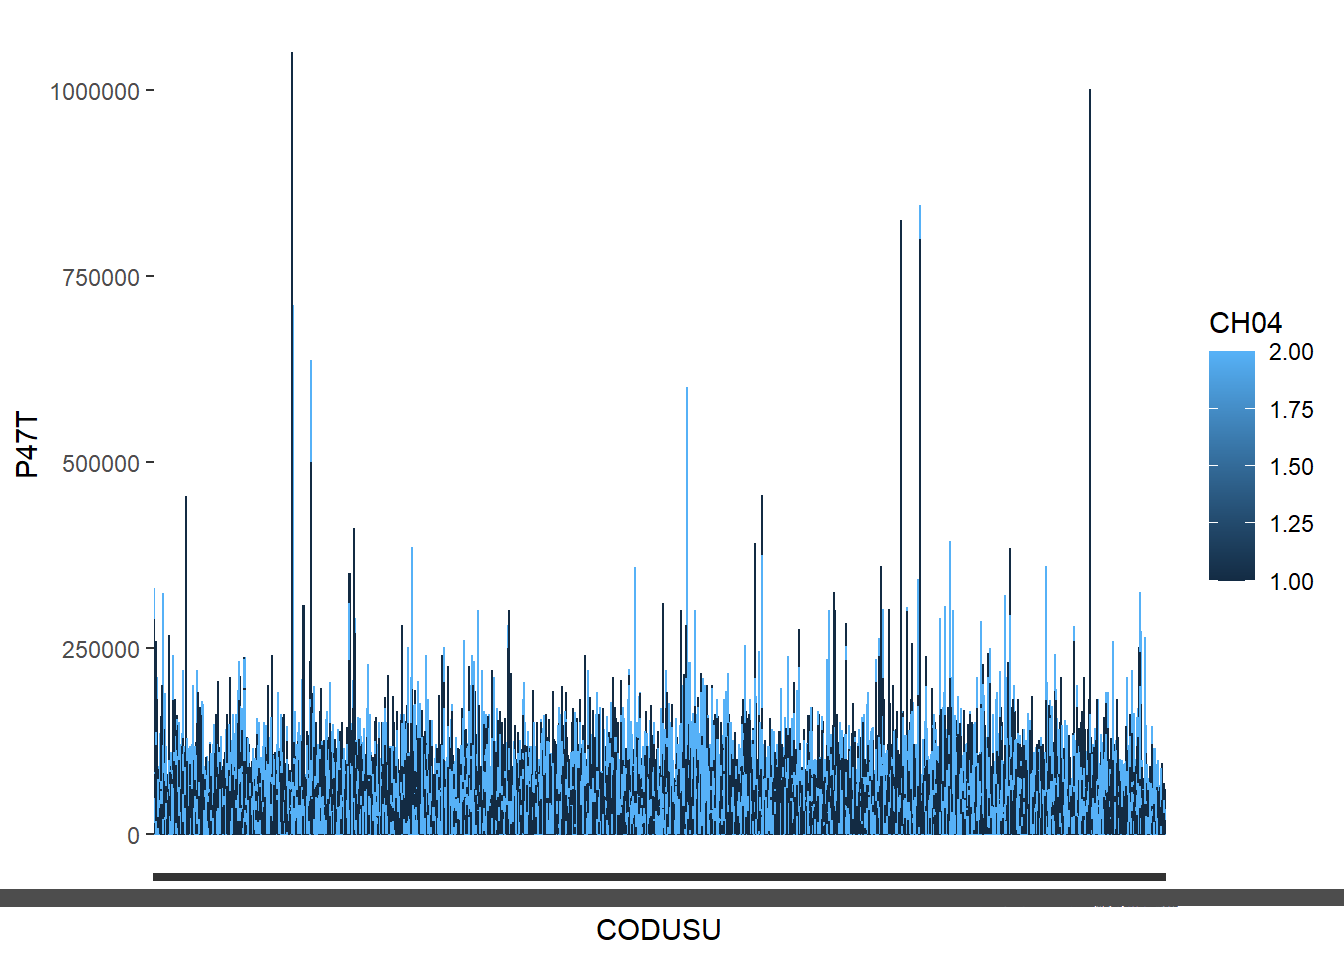
Irene Lindenboim
enero_julio_programas %>%
  mutate(planificado_millones=planificado, ejecutado_millones=ejecutado) %>%
      ggplot() +
      geom_col(aes(x=mes, y=planificado_millones, fill=programa)) +
    labs(title = "Planificación y ejecución de programas", subtitle = "Montos en $ - enero a julio 2021", caption = "Observaciones: en las columnas se encuentran los montos planificados y en las líneas los montos ejecutados", x = "mes", y = "$", fill= "Programa")+
  geom_line(aes(x=mes, y=ejecutado_millones), color="red", size=1)+
  theme_dark()+
  theme(plot.caption.position = "plot",
        plot.caption = element_text(hjust = -1),
    legend.margin = margin(0, 10, 0, 10),
    plot.title = element_text(hjust = 0, vjust = 3, family = "mono"),
    panel.grid.major = element_line(color = "black"),
    plot.margin = margin(100, 50, 100, 50),
    legend.position = "left",
    legend.justification = "left",
        legend.box.background = element_rect(size = 5, color = "red"),
    text = element_text(color = "red"),
    axis.text = element_text(color = "red"),
    legend.text = element_text(color = "red"))+
    scale_fill_manual(values=c("red","blue", "white", "black", "yellow", "green" ))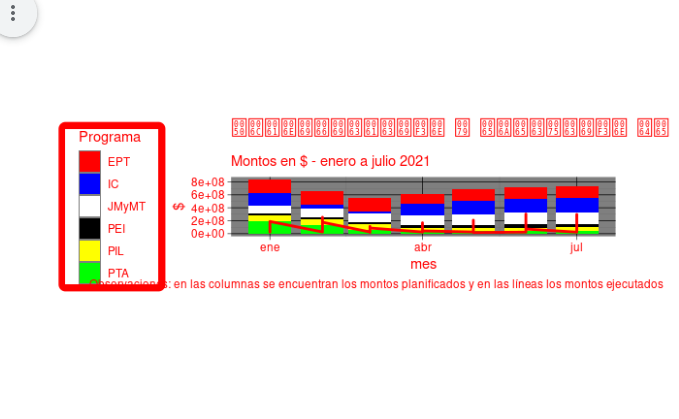
Juan Videla
library(ggplot2)
library(datos)
library(dplyr)

aviones2002<- aviones %>%
              filter(anio == "2002" )

ggplot(aviones2002, aes(fabricante))+
  geom_bar(aes(fill=fabricante))+
  scale_x_discrete(labels = c("Mirá las", "referencias", "en el","recuadro", "rojo"))+
  scale_y_continuous(breaks = seq(0, 200, 3.5), expand = c(0.1,0))+
  labs(x = "FaBrIcAnTe",  y= "Cantidad",
       title = "Cantidad de aviones por fabricante en el año 2002",
       caption = "Cualquier similitud entre los colores y el fútbol es pura coincidencia")+
  scale_fill_manual(values = c("#00008B","#0000FF", "#FFD700", "#DAA520", "#6A5ACD"))+
  theme_dark()+
  theme(legend.position = c( 0.7, 0.7),
        legend.background = element_rect(fill = "red", color = NA),
        panel.grid = element_line("red"))
Juan Pablo Costa
library(tidyverse)
library(ggplot2)
library(datos)

diamantes <- datos::diamantes


ggplot(diamantes)+
  geom_bar(aes(x=corte, fill=claridad))+
  labs(
    x="Tipo",
    y="Cantidad",
    title = "Cantidad de diamantes por tipo y claridad",
    fill = "Claridad")+
  scale_y_continuous(limits = c(0, 25000),
                     breaks = seq(0, 25000, 10000),
                     expand = c(2, 2))+
  scale_fill_manual(values=c("red","blue", "darkorange", "purple", "cyan4", "green", "orange", "pink" ))+
  theme_dark()+
  theme(legend.position = c( 0.7, 0.7),
        legend.background = element_rect(fill = "red", color = NA),
        panel.grid = element_line("red"))+
  save.image("datos/grafico_feo.jpg")
Julieta Couto
library(ggplot2)
library(datos)
library(dplyr)

ggplot(paises, aes(esperanza_de_vida, pib_per_capita)) +
  geom_point( aes( color=continente), shape = 3, alpha = 0.2) +
    labs (
    title = "esp_vida-pbi_per_cap-cont",
       x="esp_vida",
       color= "cont") +
  scale_x_log10()+
  scale_color_viridis_d(option = "G") +
  theme_minimal()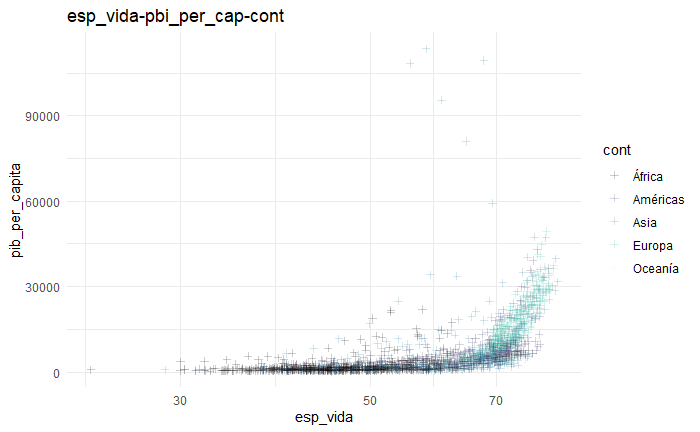
Luciano Tincani y Pamela Sarco
library(ggplot2)

df = data.frame(Formacion = c("Soci?logo", "Economista", "Geografa",
                              "Relaciones Laborales", "Lic en Sistemas",
                              "Licenciatura en Analisis de Sistemas",
                              "Polit?logx","Administracion",
                              "Ingeniera en inform?tica",
                             "Analista de Sistemas","Edici?n Editorial",
                             "LIc. Administracion","Soci?logo"),#categorias
                Proporcion = c( .05, .05, .05, .05, .05, .05, .05, .05, .05, .18,
                                .23, .05, .09))

#
ggplot(df, aes(x = "", y = Formacion, fill = Proporcion)) +
  geom_col() +
  coord_polar(theta = "y")

ggplot(df, aes(x = "", y = Formacion, fill = Proporcion)) +
  geom_col(color = "yellow") +
  geom_label(aes(label = Formacion),
             color = "red",
             position = position_stack(vjust = 0.5),
             show.legend = FALSE) +
             coord_polar(theta = "y")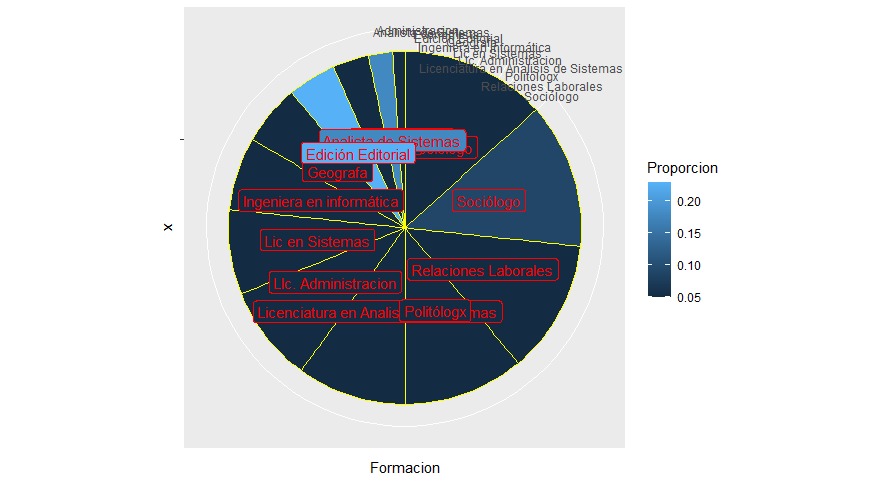
Manuel Emilio Lopez
gob_local %>%
    ggplot(aes(prov,localidad))+
    geom_point(aes(color= region, size = pob/100000, shape = genero), alpha = 0.5) +
    labs(title = "Cantidad de localidades por Provincia",
       subtitle = "Según región, población y género de su intendentx",
       caption = "*La CABA está desagregada por Comunas",
       x = "provincias",
       y = "Localidades",
       color = "Región",
       size = "Población \npor 100.000 hab")+
            theme_light() +
    theme(axis.text.x = element_text(angle = 45, hjust = 1), axis.text.y=element_blank())+
    scale_color_brewer(type = "qual", palette = "Dark2")+
  scale_size_area(max_size=15)+
  theme(legend.position = "bottom",plot.margin = unit(c(0, 0, 0, 0), "cm"),
      panel.grid = element_line(linetype = 3))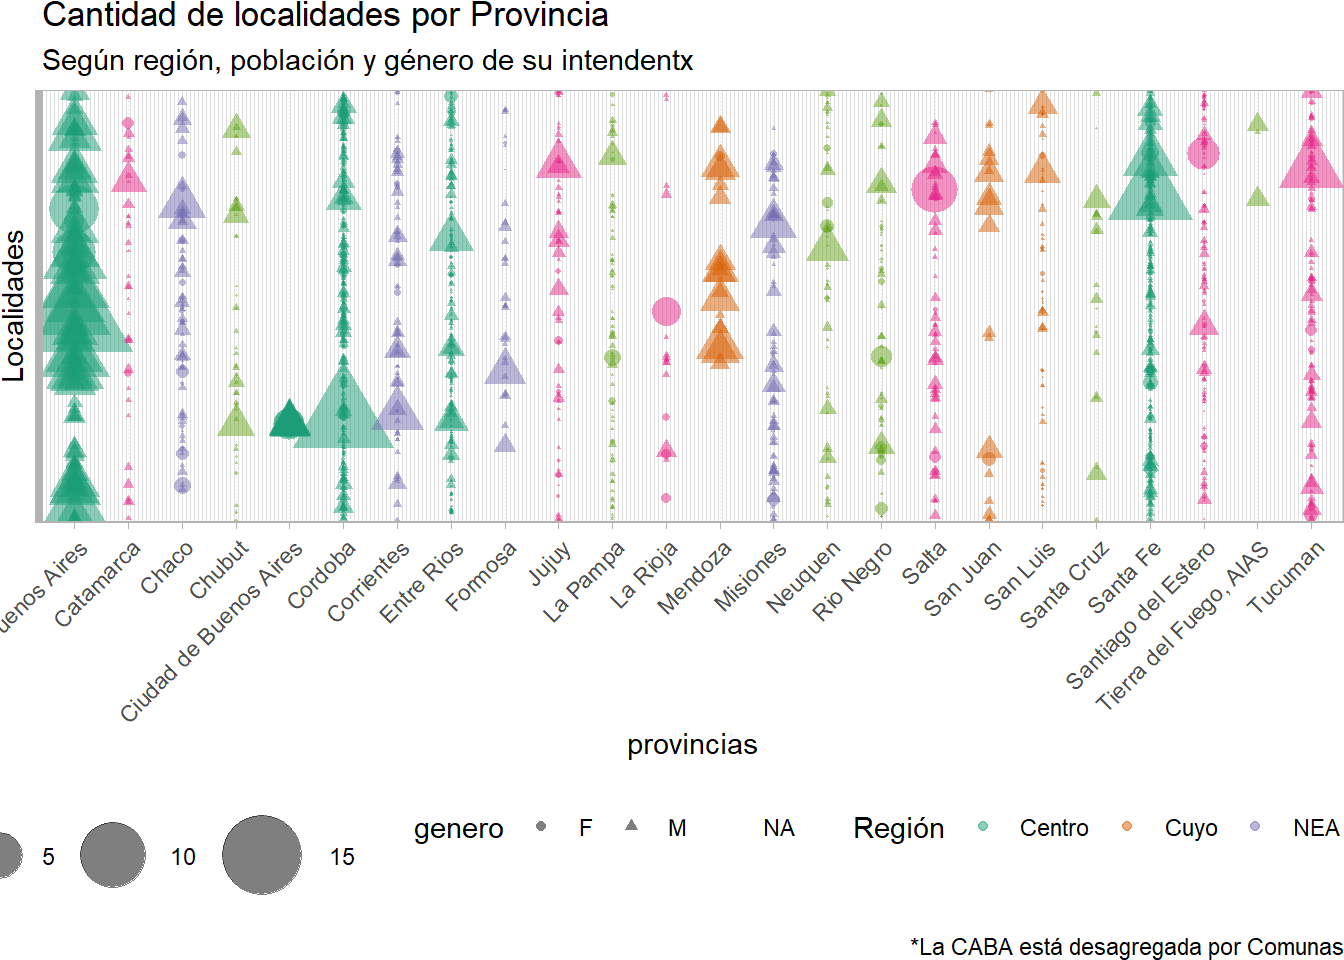
Gráfico extra
gob_local %>%
    group_by(prov,region)%>%
    summarise(localidad=n(), pob=sum(pob,na.rm = TRUE))%>%
   ungroup() %>%
  mutate(prov = fct_reorder(prov, desc(pob))) %>%
  mutate(prov = fct_reorder(prov, region)) %>%
    ggplot(aes(prov,localidad))+
    geom_point(aes(color= region, size = pob/100000)) +
    labs(title = "Cantidad de localidades por Provincia",
       subtitle = "Según región y población",
       caption = "El tamaño de cada punto representa la población total de cada provincia",
       x = "",
       y = "Localidades",
       color = "Región",
       size = "Población \npor 100.000 hab")+
            theme_light() +
    theme(axis.text.x = element_text(angle = 45, hjust = 1))+
    scale_color_brewer(type = "qual", palette = "Dark2")+
  scale_size_area(max_size=15)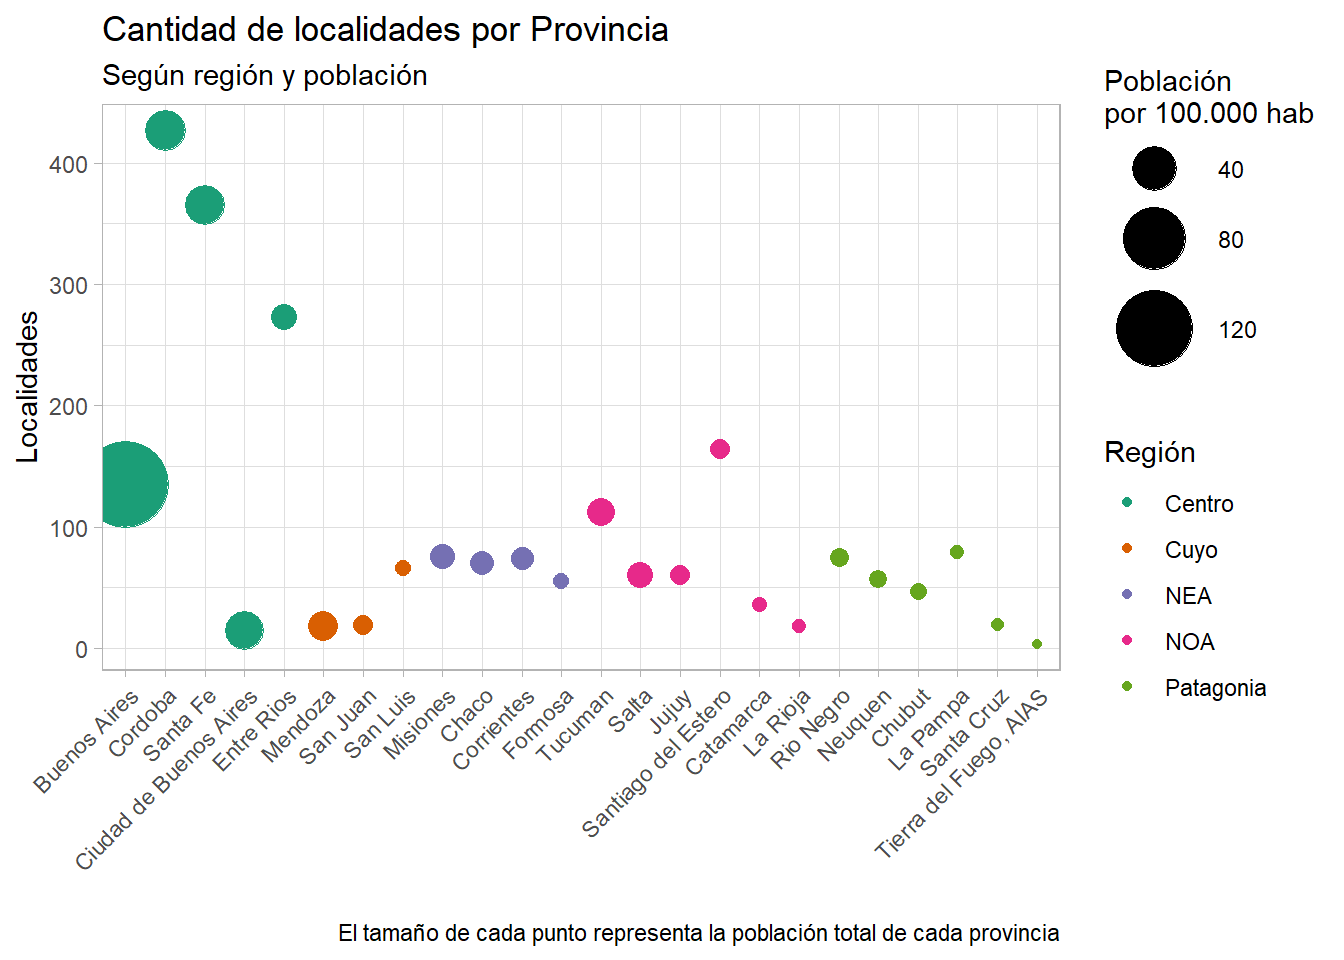
Marcela Almeida
Gastos__quintil_uno <- base_hogares %>%
  filter(qinth_t==1)%>%
    select(gc_01,gc_02, gc_03, gc_04, gc_05, gc_06, gc_07, gc_08, gc_09, gc_10, gc_11, gc_12,pondera, qinth_t)%>%
  summarise(Alimentos=round( sum(gc_01*pondera)/sum(pondera),1),Tabaco= round( sum(gc_02*pondera)/sum(pondera),1),Ropa=round( sum(gc_03*pondera)/sum(pondera),1),Vivienda=round(sum(gc_04*pondera)/sum(pondera),1), Equipamiento=round(sum(gc_05*pondera)/sum(pondera),1), Salud=round( sum(gc_06*pondera)/sum(pondera),1), Transporte=round( sum(gc_07*pondera)/sum(pondera),1), Comunicacion=round( sum(gc_08*pondera)/sum(pondera),1), Recreacion=round( sum(gc_09*pondera)/sum(pondera),1), Educacion=round( sum(gc_10*pondera)/sum(pondera),1), Restaurantes=round( sum(gc_11*pondera)/sum(pondera),1), Otros=round( sum(gc_12*pondera)/sum(pondera),1))%>%
  pivot_longer(cols=c(Alimentos, Tabaco,Ropa, Vivienda, Equipamiento, Salud, Transporte, Comunicacion, Recreacion, Educacion, Restaurantes, Otros ),names_to="Gasto", values_to="valor")


Gastos_quintil_uno<-Gastos__quintil_uno%>%
  mutate(porcentaje=(valor/11322.9)*100)

Gastos_quintil_uno

torta_fea<-ggplot(data=Gastos_quintil_uno, aes(x="", y=valor, fill=Gasto))+
  geom_bar(stat="identity")+
    labs(title="Estructura de gasto Quintil 1", caption="Siempre puede ser más feo")+
  geom_text(aes(label=paste0(round(porcentaje,1),"%")),
            position=position_stack(vjust=0.5))+
  coord_polar("y")+
    theme_void()

torta_fea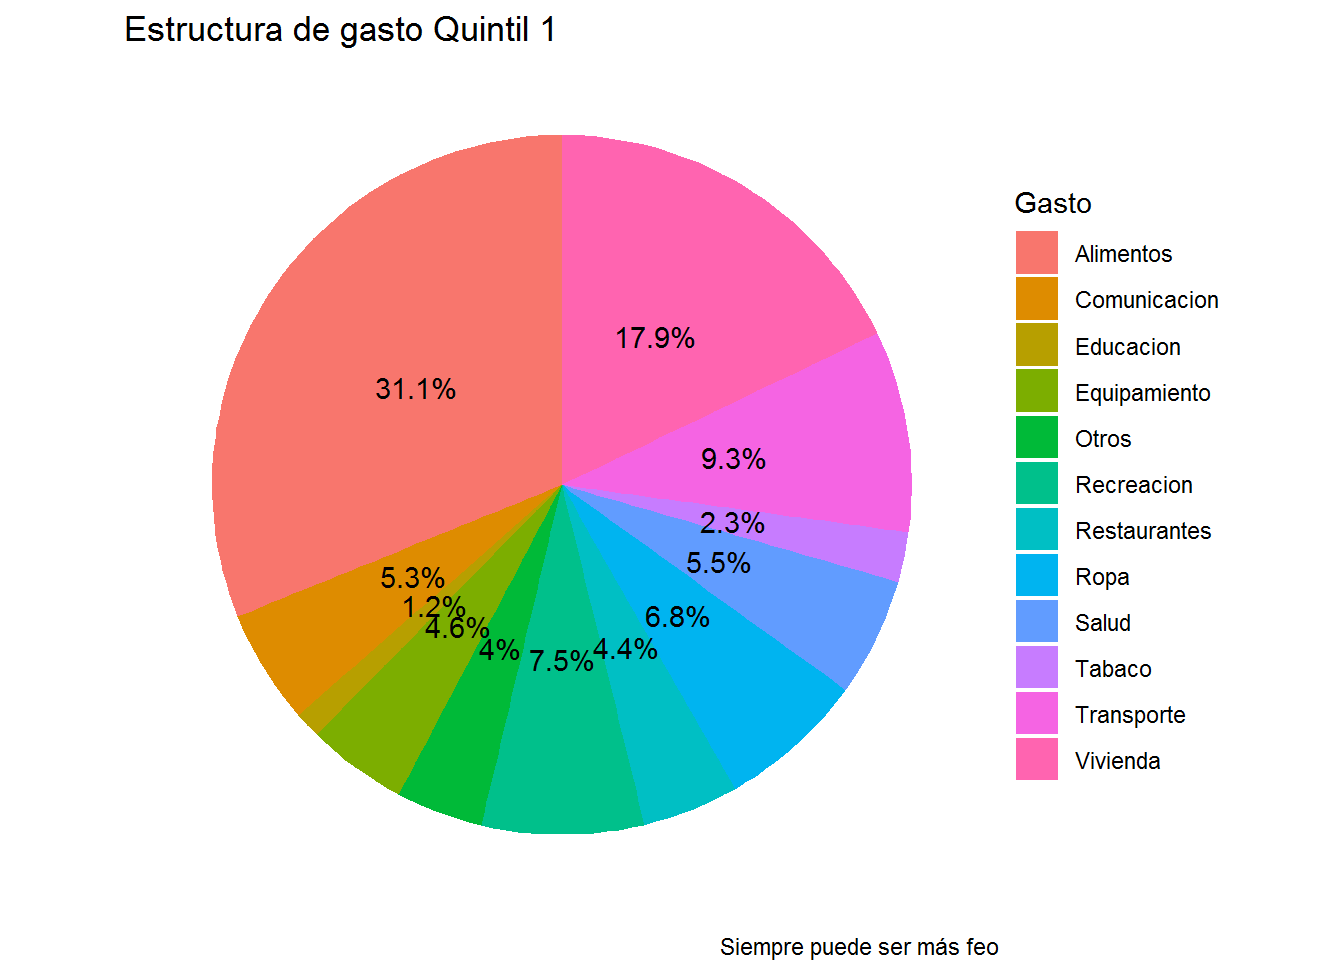
Gráfico extra
# Siempre puede ser más feo... pero no es ggplot

pie3D(Gastos_quintil_uno$porcentaje)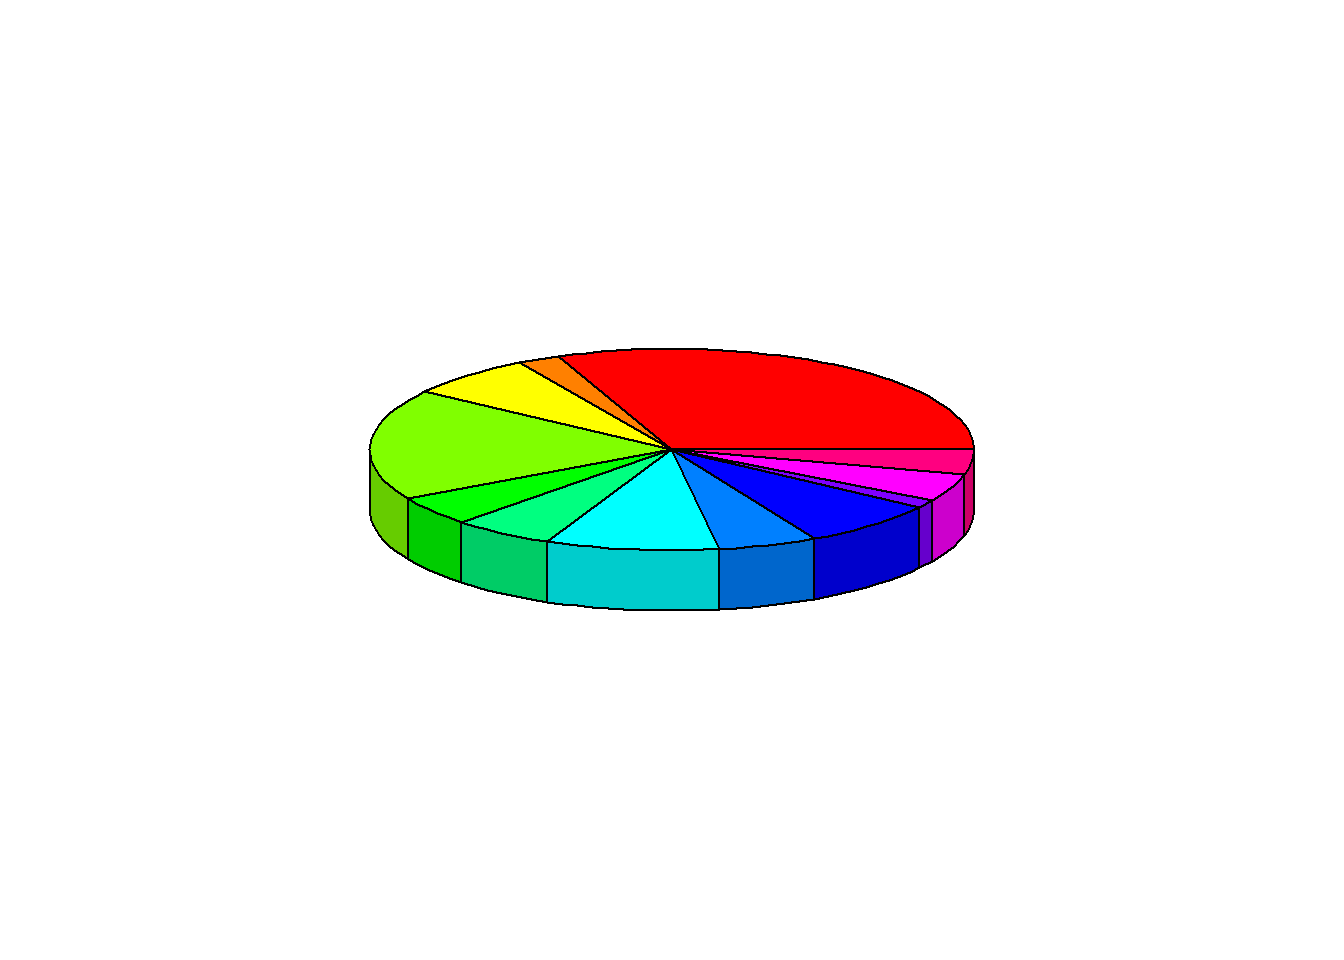
Marcelo Perazzo
library(ggplot2)
library(tidyverse)
library(dplyr)
remotes::install_github("cienciadedatos/datos")
pinguinos=datos::pinguinos

pinguinos %>%
    remove_missing() %>%
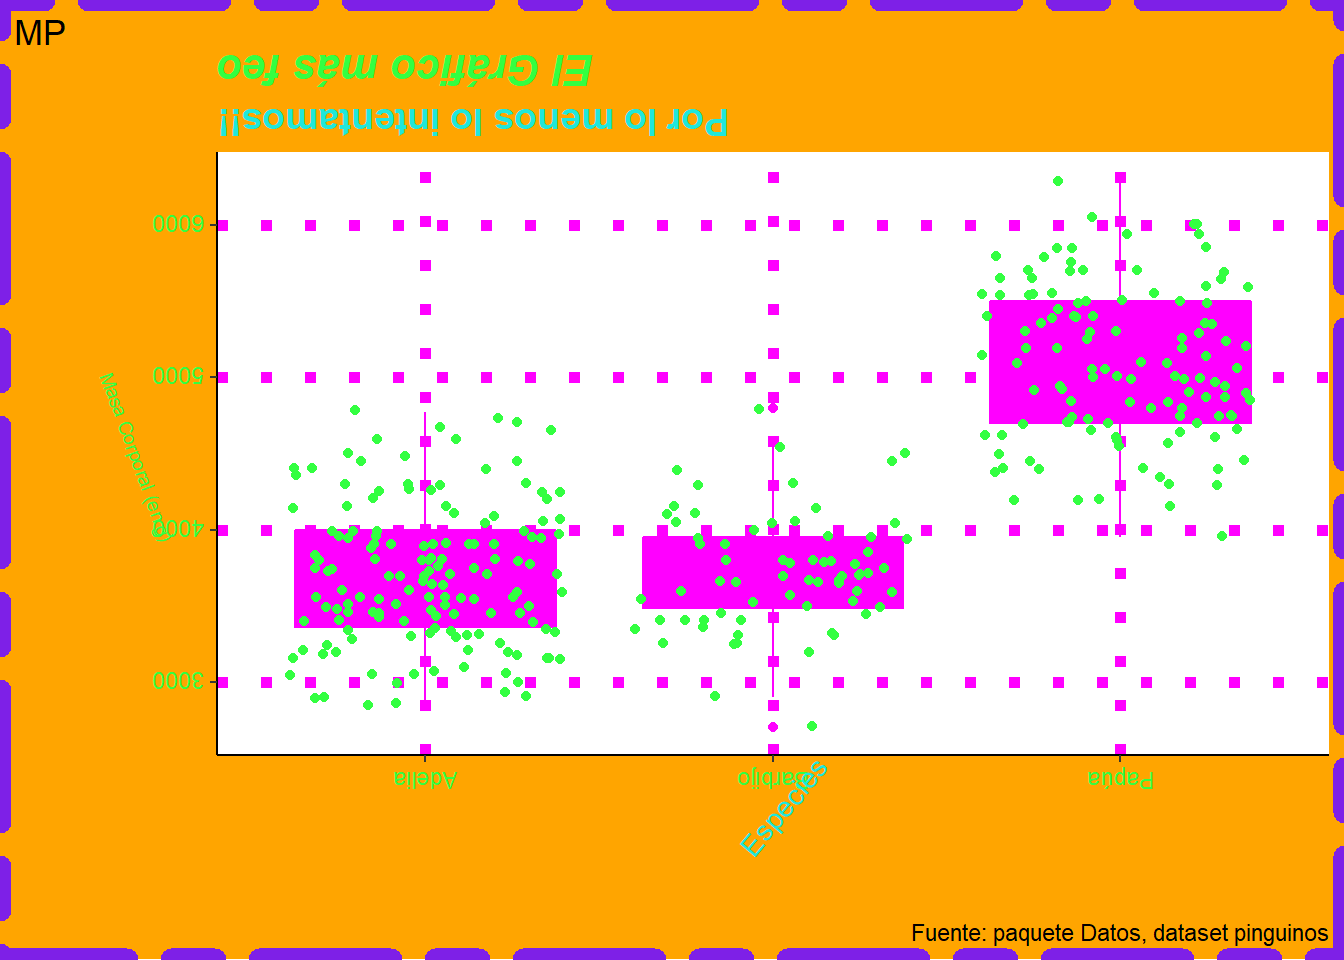
    ggplot(aes(x = especie, y = masa_corporal_g
          )) +
    geom_boxplot(fill="#FF00FF", color="#FF00FF") +

  geom_jitter(fill="#33FF41",color="#33FF41") +


  theme_classic()+
  theme(panel.grid.major = element_line(color = "#FF00FF",linetype="dotted",size = 2),
        plot.title = element_text(face = "bold.italic", size = 16,color = "#33FF41",hjust = 1,angle = -180),
        plot.subtitle = element_text(face = "bold", size = 14,color = "#20E7DA",hjust = 1,angle = -180),

        axis.text = element_text(color = "#33FF41", angle = -180),
        axis.title.x = element_text(color ="#20E7DA",angle = 50 ),
        axis.title.y = element_text(color ="#33FF41",size = 7,angle = -70 ),
        plot.background = element_rect(fill="orange",color =  "#7E20E7", size = 4,linetype = "twodash"),


  )+

     labs(x = "Especies",
           y = "Masa Corporal (en g)",
          title = "El Gráfico más feo",tag = "MP",
          subtitle = "Por lo menos lo intentamos!!",
          caption = "Fuente: paquete Datos, dataset pinguinos"
          )
Martin Saralegui
library(datos)
library(ggplot2)
library(dplyr)
library(tidyverse)

pinguinos <- datos::pinguinos

ggplot(pinguinos, aes(largo_pico_mm, largo_aleta_mm))+
  geom_point(aes (color= especie, size = masa_corporal_g))+
  geom_text(aes(label = sexo, size= 1))+
  geom_smooth(method = "loess", aes(color= especie))+
  annotate('text', x = 45, y = 200, label = "Diome", fontface = "bold", size = 10)+
  geom_curve(aes(x= 45, y= 200, xend= 50, yend = 220),
             arrow = arrow(angle = 30, length = unit(0.25,"inch"),
                           ends="first",
                           type= "closed"),
             size = 1,
             color = "yellow",
             curvature = 0.2)+
  geom_segment(aes(x= 45, y= 200, xend= 40, yend = 175),
             arrow = arrow(angle = 30, length = unit(0.25,"inch"),
                           ends="first",
                           type= "closed"),
             size = 1,
             color = "darkred",
             curvature = 0.2)+
  geom_density_2d(aes(color= especie), size = 1)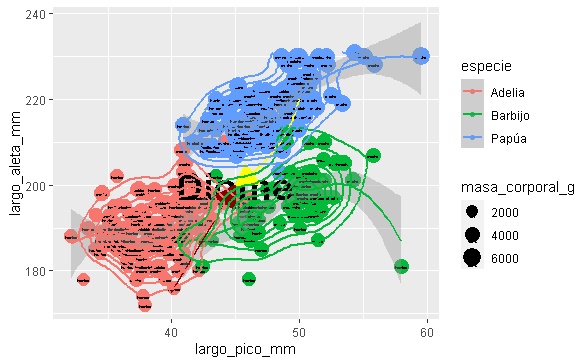
Martina Pesce
library(tidyverse)
library(here)
library(ggimage)
library(ggplot2)
library(ggrepel)
pinguinos<-datos::pinguinos

ggplot(pinguinos, aes(largo_pico_mm, masa_corporal_g)) +
  geom_point(aes(colour = isla, size = largo_aleta_mm)) +
  geom_text_repel(aes(label=ifelse((masa_corporal_g >= 5000 |largo_pico_mm> 50), as.character(especie),'')), min.segment.length = 0, seed = 42, box.padding = 0.5)+
  theme(legend.position = "none")+
  theme_void()+
  theme(plot.background = element_rect(fill = "green", colour = "lightblue"))+
  theme(panel.border = element_rect(linetype = "dashed", fill = "NA"))+
  theme(panel.grid.major = element_line(colour = "magenta"))+
  theme(plot.title = element_text(color = "red"))+
  labs(title="Gráfico Pinguinos)",
        x ="largo del pico en mm", y = "masa corporal g")+
geom_pokemon(aes(image= 'pikachu'), size=.1)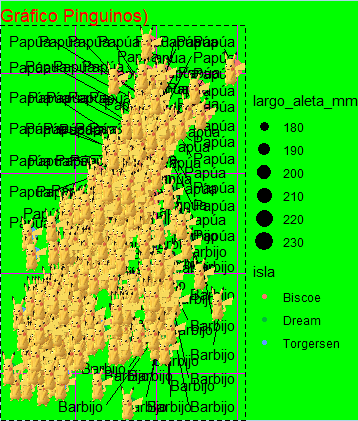
Mercedes Araujo
# Base de datos de alquileres.

unique(datos_alquileres$operation_type)
Datos<-datos_alquileres %>%
  filter(operation_type == "Alquiler" ) %>%
  filter(l2 == "Capital Federal") %>%
  filter(price < 100000 ) %>%
  filter(surface_total < 15000 ) %>%
  filter(surface_covered < 2000 ) %>%
  filter(start_date >= "2020-01-01" ) %>%
  filter(property_type=="Casa" | property_type=="PH" | property_type=="Departamento")


ggplot(data = Datos) +
 geom_point(aes(x = surface_covered, y = price),
 alpha = .6, color="green", size=8) +
 labs(x="Superficie cubierta", y = "Precio") +
 geom_abline(aes(intercept = 9423.48,
 slope = 245.24), color = "pink") +
   facet_wrap(~property_type, scales="free_y")+
  theme_dark()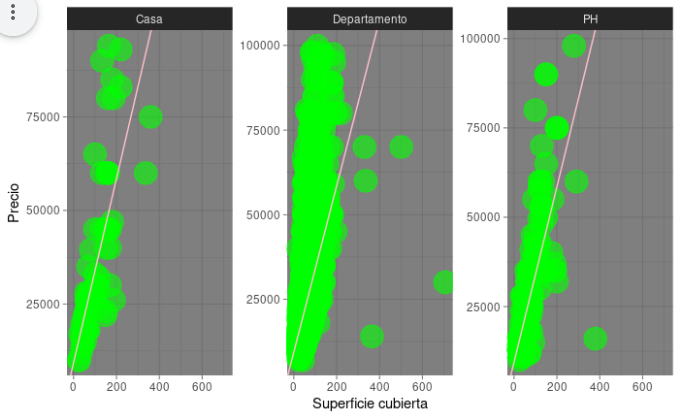
Mercedes Laurenza
library(dplyr)
library(ggplot2)

feo <- final_internados %>%
  group_by(region) %>%
  summarise(total = n())

inmundus_palette <- c("yellow", "#8e4f89", "#4269a5","#39825a", "#dc6141", "#0078d7" )

feo <- feo %>%
  filter(!is.na(region)) %>%
  ggplot(aes(x=region, y=total, fill= as.factor(total))) +
  scale_fill_manual(values = inmundus_palette )+
    geom_bar(width = 1 ,stat="identity")+
  labs(fill= "Internados total", title= "Total de internados por región por COVID 19", subtitle="Rep. Argentina, marzo 2020- mayo 2021", caption = "Fuente: datos abiertos Ministerio de Salud de la Nación; N= 112097")+
    guides(fill =  guide_legend(reverse = TRUE))

  feo + coord_polar() +
theme(axis.text.x=element_text(size = 15,angle = 80, colour = "red", face= "bold"))+
                theme(title=element_text(size=15,face="bold"))

ggsave('feo.png', width = 16, height = 9, dpi = 100)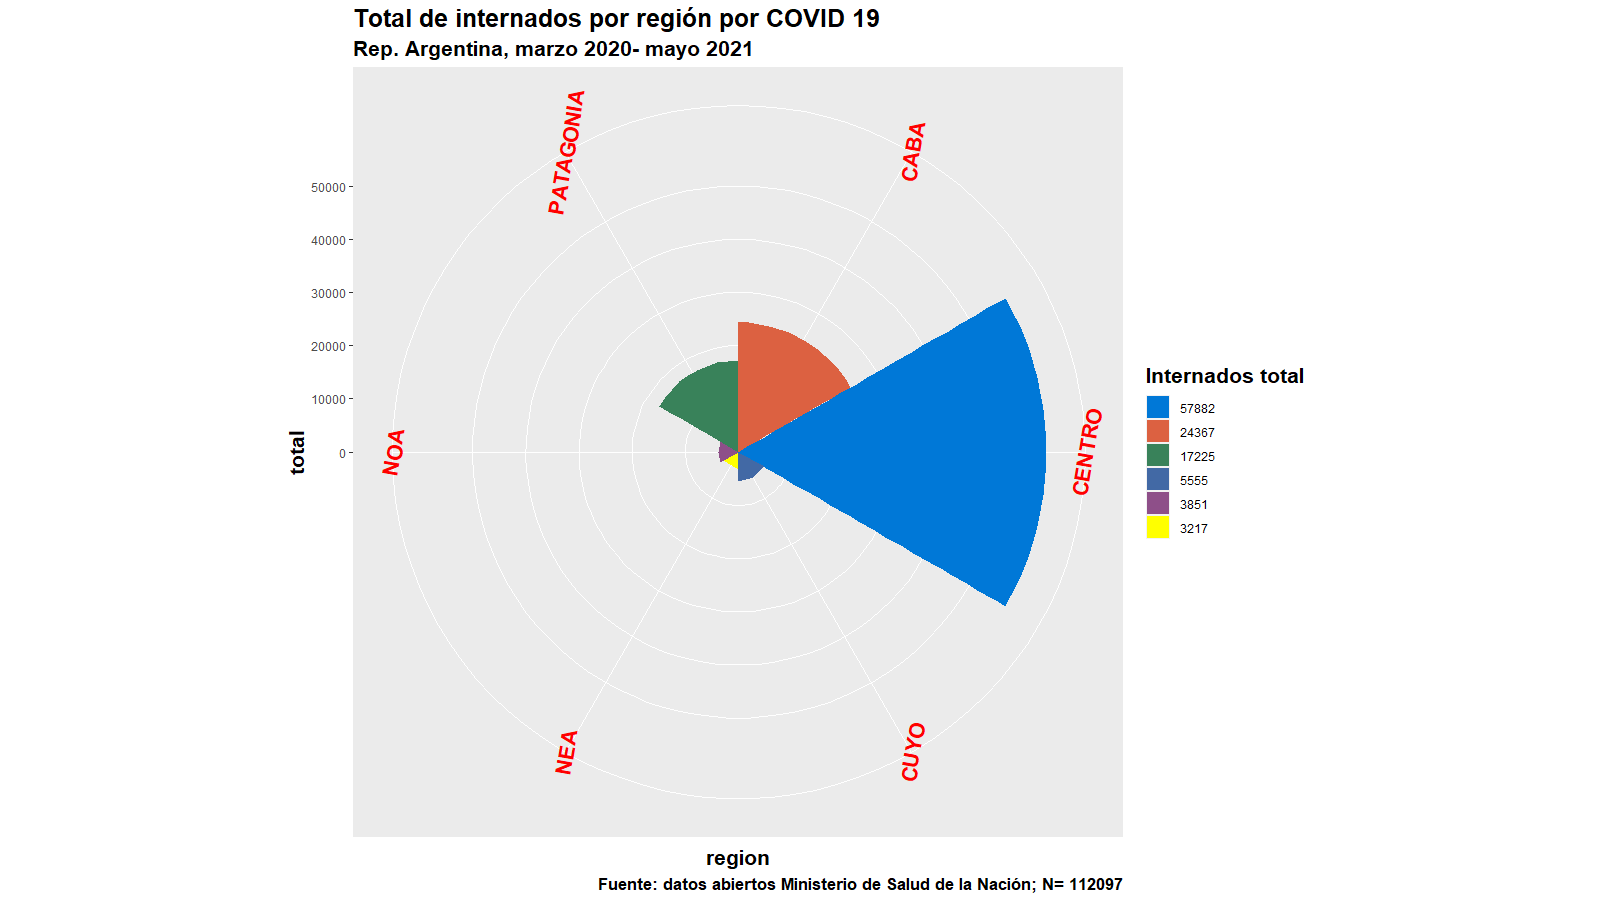
Nicolas Capria
library(tidyverse)
library(eph)

base <- get_microdata(year = 2021, trimester = 1, type = "individual", vars = c('P21', 'ESTADO', 'CAT_OCUP', 'CH04', 'CH06', 'CH07', 'CH08', 'PP04B_COD', 'PP04D_COD', 'PONDERA','ANO4','PONDIIO'))

base_trabajo <- base %>%
  organize_labels()

base_trabajo <- base_trabajo %>%
  organize_cno()

base_trabajo <- base_trabajo %>%
  organize_caes()


base_trabajo <- base_trabajo %>%
 rename(Genero = CH04, rama_de_actividad = caes_eph_label) %>%
 mutate(Genero = case_when(Genero=="1" ~ "Varones",
                         Genero=="2" ~ "Mujeres"))

formato_porc <- function(numero, dec = 1){
  format(round(numero, digits = dec), nsmall = dec, decimal.mark = ",",)
}
formato_pesos <- function(numero, dec = 2){
  paste0("$", format(round(numero, digits = dec), nsmall = dec, big.mark = ".", decimal.mark = ","))
}
formato_cantidad <- function(numero, dec = 0){
  format(round(numero, digits = dec), nsmall = dec, big.mark = ".", decimal.mark = ",")
}

Tabla.6 <- base_trabajo %>%
  filter(!is.na(rama_de_actividad)) %>%
  group_by(rama_de_actividad, Genero) %>%
  summarise(Percentage=n()) %>%
  group_by(rama_de_actividad) %>%
  mutate(Percentage=Percentage/sum(Percentage)*100)%>%
  mutate_if(is.numeric, round) %>%
  filter(Genero == "Mujeres")

Tabla.9<-  base_trabajo %>%
  filter(ESTADO == 1) %>%
  group_by(rama_de_actividad, Genero) %>%
  summarise(ing_prom_rama = weighted.mean(P21, PONDIIO)) %>%
  pivot_wider(id_cols = 1, names_from = Genero, values_from = ing_prom_rama) %>%
  mutate(brecha_por_rama = (Varones-Mujeres)/Varones *100) %>%
  arrange(brecha_por_rama)

Tabla.10 <- Tabla.6 %>%
  left_join(Tabla.9, "rama_de_actividad")

Tabla.11 <- Tabla.10 %>%
  mutate(rama_de_actividad = case_when(rama_de_actividad == "Transporte, almacenamiento y comunicaciones" ~ "Transporte",
                                       rama_de_actividad == "Servicios financieros, de alquiler y empresariales"  ~ "Servicios financieros",
                                      rama_de_actividad =="Administracion publica, defensa y seguridad social"  ~ "Sector público",
                                      rama_de_actividad == "Otros servicios comunitarios, sociales y personales" ~ "Otros servicios com.",
                                      rama_de_actividad == "Actividades no bien especificadas" ~ "Act. no especificadas", TRUE ~ as.character(rama_de_actividad)))

Tabla.11<- Tabla.11 %>%
  rename(Sector = rama_de_actividad)

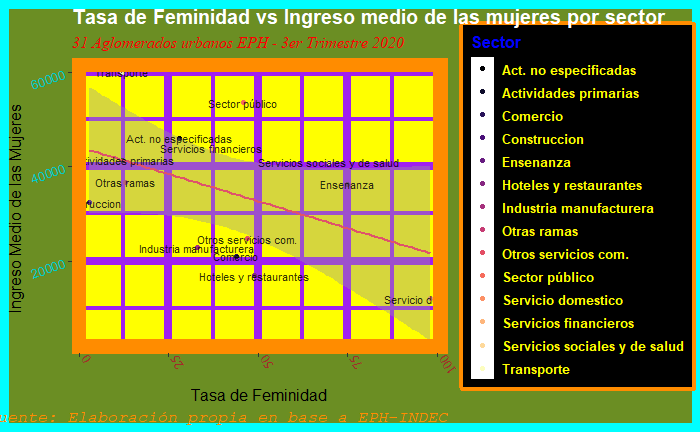
ggplot(data = Tabla.11) +
  (aes(Percentage,  Mujeres)) +
  geom_point(aes(color = Sector)) + geom_smooth (method="lm", col = "2") + geom_text(aes(label= Sector), size=3, alpha = 0.8 )+ scale_color_viridis_d(option = "A") +
  labs(title = "Tasa de Feminidad vs Ingreso medio de las mujeres por sector",
     subtitle = "31 Aglomerados urbanos EPH - 3er Trimestre 2020",
     caption = "Fuente: Elaboración propia en base a EPH-INDEC",
     x = "Tasa de Feminidad",
     y = "Ingreso Medio de las Mujeres ") +
  theme_bw(12)+
  theme(legend.title = element_text(color = "blue", face = "bold"),
    legend.text = element_text(family= "Trebuchet MS", color = "yellow", face = "bold"),
    panel.background = element_rect(fill="yellow"),
    panel.border = element_rect(size = 10, color = "darkorange"),
    legend.background = element_rect(fill = "black"),
    legend.box.background = element_rect(size = 3, color = "darkorange"),
    plot.background=element_rect(fill="olivedrab", color="cyan", size = 6),
    panel.grid = element_line(linetype = 1, size = 3, color = "purple"),
    plot.title=element_text(color="white", size =15, family = "sans", face = "bold"),
    plot.subtitle=element_text(color="red", size =12, family = "serif", face = "italic"),
    plot.caption =  element_text(color="darkorange", size =12, family = "mono", face = "italic"),
    axis.text.x= element_text( family= "serif", color = "brown", angle= 125, hjust= 1),
    axis.text.y= element_text( family= "sans", color = "cyan3", angle= 20, hjust= 1)
      )
Nicolas Natali
ggplot(paises,aes(poblacion,esperanza_de_vida))+
  geom_line(aes(color = continente))+
  scale_x_log10()+
  scale_y_continuous(limits = c(0,140),
                     breaks = seq(0,140, 13))+
  theme_dark()
### Nicole Moscovich
ggplot (educ_ingresos) +
geom_boxplot (aes(x= NIVEL_EDUC,  y = promedio_ingresos, fill= factor(NIVEL_EDUC) ) )  +
    geom_line(data= educ_ingresos4, aes(x = NIVEL_EDUC, y = promedio_ingresos)) +
  geom_jitter(data = educ_ingresos1, aes( x = NIVEL_EDUC , y = promedio_ingresos ,   colour = factor(educ_ingresos1$SEXO)) , size = 10 ) +

  labs (title = "Ingresos promedio por nivel educativo alcanzado",
         caption = "Fuente: EPH 2019",
         x = "NIVEL EDUCATIVO ALCANZADO",
         y = "INGRESOS",
        colour= "Sexo",
        fill= "Nivel educativo") +
  theme_bw()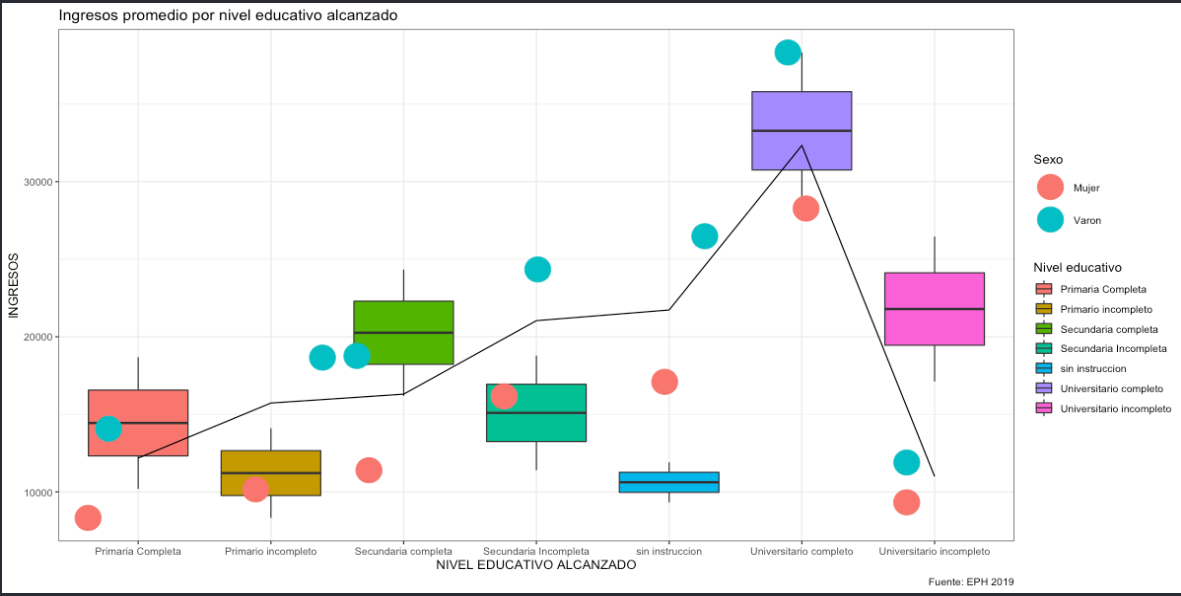
Noelia Andrada
vict_denuncia_embarazadas%>%
group_by(embarazo)%>%
count()%>%
ungroup()%>%
mutate(porc=n/sum(n)*100)%>%
ggplot(aes(x=1, y=porc, fill=embarazo)) +
  geom_bar(stat="identity") +
  geom_text(aes(label = paste0(round(porc,10),"%")),
            position = position_stack(vjust = 0.5)) +
  coord_polar(theta = "y") +
  theme_void() +
  scale_fill_brewer(palette="RdGy")+
  ggtitle("Porcentaje de víctimas embarazadas según situación de embarazo") +
      labs(caption ="Fuente: Elaboración propia en base a datos de la tabla *Víctimas de accionar represivo ilegal* de la base de datos PRESENTES")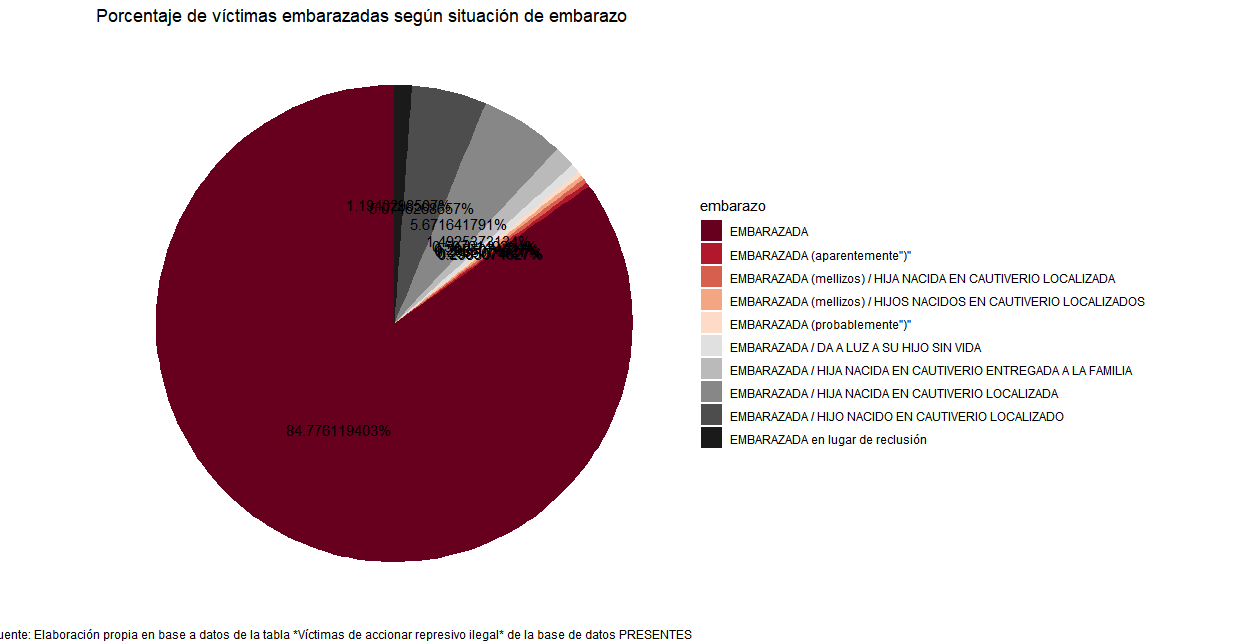
Paula DAlessandro
#Base de datos: calidad de aire 2017

ggplot(data=calidad_aire_dia, aes(NO2_COR2,CO_COR1, color=FECHA )) +
  geom_point(aes(color=FECHA,size=3,alpha=0.8))+
  geom_smooth(method = "lm",se=FALSE, aes(color=FECHA))+  labs(title="Mediciones calidad de aire", x="Contaminante medido (NO2)", y="Contaminante medido (CO)", color="NO2_COR2", sharpe="CO_COR1") + theme_minimal()+theme(legend.position = c(0.85,0.15))+ theme(legend.background=element_rect(fill="white", color=NA))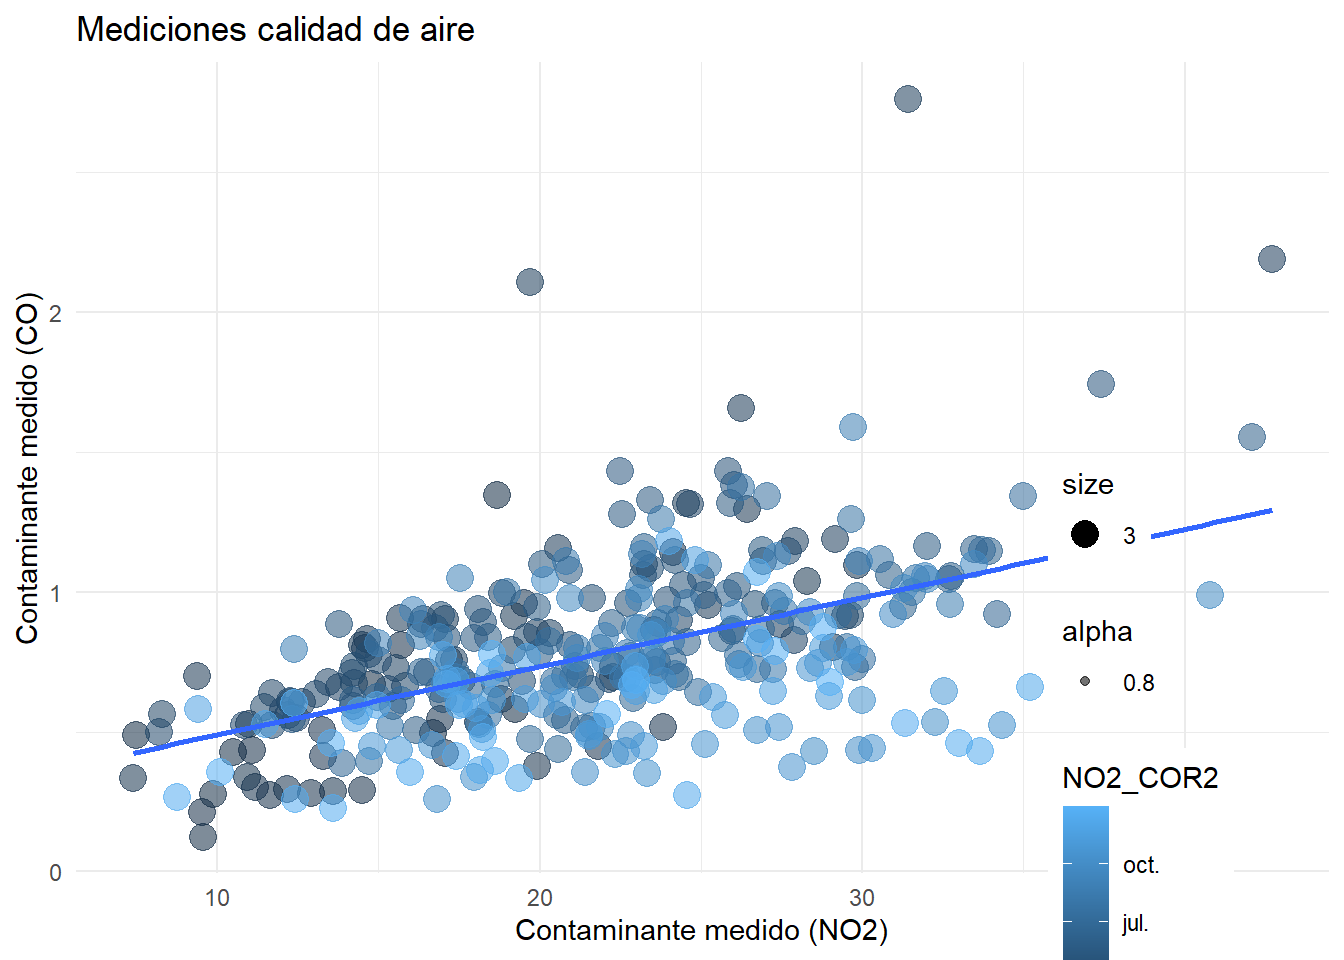
Samantha Vaccari
Maximos <-emisiones_gei %>%
  group_by(sector) %>%
  filter(emisiones == max(emisiones))


ggplot(emisiones_gei, aes(anio, emisiones))+
   geom_line(aes(color = sector))+
   geom_point()+
   geom_label(aes(label = emisiones),
              data = Maximos)+
   scale_x_continuous(limits = c(1990, 2025),
                     breaks = seq(1990,2025, 5)) +
   scale_y_continuous(limits = c(0, 250),
                     breaks = seq(0, 250, 30))+
   labs(title = "Cantidad de emisiones por año y sector",
        subtitle = "Datos de la materia Visualización de datos",
        x = "Año",
        y = "Emisiones (en megatolenadas)",
        color = "Sector")+
  theme_dark()+
  theme(
    plot.title = element_text(color = "red"),
    plot.subtitle = element_text(color ="blue"),
    axis.title.x = element_text(color = "violet"),
    axis.title.y = element_text(color = "violet"),
    legend.title = element_text(color = "red"),
    legend.text = element_text(color = "blue"))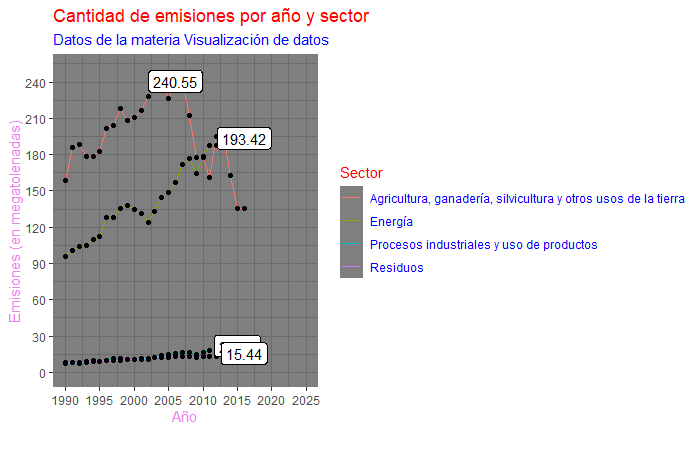
Sara Reidel
data <- read.table("https://raw.githubusercontent.com/holtzy/data_to_viz/master/Example_dataset/3_TwoNumOrdered.csv", header=T)

data$date <- as_datetime(data$date)

data  %>%
  ggplot( aes(x=date, y=value)) +
  geom_line() +
  geom_point(aes(size = value)) +
  labs(x="Mes y a?o",
       y="valor",
       title ="Evoluci?n del valor del bitcoin en el tiempo",
       subtitle = "y esperando que se pinche la burbuja",
       size= "VALOR") +
  scale_x_datetime(date_breaks = "3 months", expand = c(0,1),
                   limits = c(as_datetime("2013-01-01"),as_datetime("2018-10-01"))) +
  scale_y_continuous(breaks = seq(0,20000,10000))+
  theme_dark() +
  theme(axis.text.x = element_text(angle = 75, vjust = 0.5, hjust=0.5, colour = "red",face = "bold"),
        axis.text.y = element_text(angle = -75, colour = "red",face = "bold"),
        axis.title.y = element_text(colour = "#7b3294"),
        axis.title.x = element_text(colour = "#7b3294"),
        plot.title = element_text(colour = "yellow"),
        plot.subtitle = element_text(colour = "orange"),
        panel.background = element_rect(fill = "#a6d96a")) +
  annotate('text', x= as_datetime("2017-01-01"), y = 15000, label = "M?ximo", fontface = "bold", color="blue")+
  geom_curve(aes(x= as_datetime("2017-12-17"), y= 20089, xend=as_datetime("2017-01-01") , yend = 16000),
             arrow = arrow(length = unit(0.07, "inch")), size = 0.5,
             color = "blue",
             curvature = 0.3)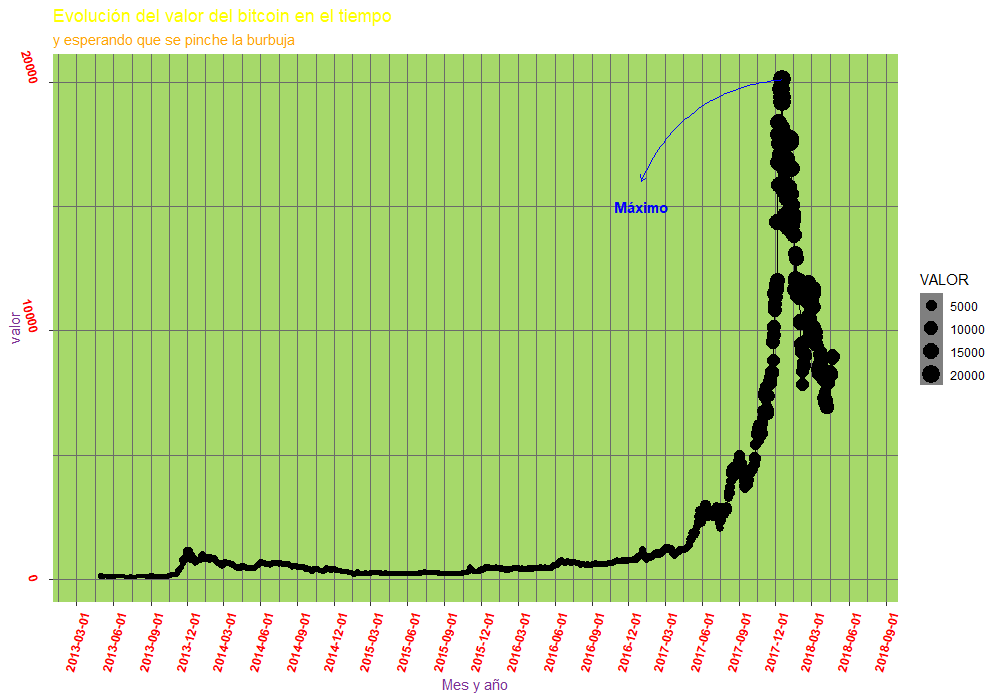
Walter Martinez
edificio = c(15,16,18,18,12,12,15,10,15,22,14,14,16,4,8,5,7,3,9,12)
edificio1 = c(9,9,13,14,9,2,11,7,8,16,11,1,7,3,1,2,5,2,6,10)
edificio2 = c(7,5,10,11,6,1,6,3,5,13,8,7,11,2,3,1,2,1,3,6)
edificio3 = c(4,2,7,7,4,7,4,2,2,8,5,5,5,1,4,3,4,0,1,3)
estrella=c(19,22,21,19,24,27,24,22,22,28,25,25,25,21,24,23,24,20,21,23)
noche = paste("P", 1:20)
caballero = rep((c("noche","Testigo")),c(10,10))
img <- readPNG("datos/imga.png",native = TRUE)
df = data.frame(caballero, noche, edificio)

luz= c(15,16,18,18,12,12,25,10,15,22,14,14,16,4,8,5,7,3,9,12)
luzx= paste("P", 1:20)

ggplot(data=df, aes(x=noche, y=edificio)) +
    geom_bar(stat="identity", position="stack")+
    labs(title="Resultados de una noche de estudio de R")+
    geom_point(shape = 15, color='yellow',
    position = position_dodge(width=1), aes(noche,edificio1)) +
    geom_point(shape = 8, color='orange3',
    position = position_dodge(width=1), aes(noche,estrella))+
    geom_point(shape = 15, color='#899DA4',
    position = position_dodge(width=1), aes(noche,edificio2))+
    geom_point(shape = 15, color='yellow',
    position = position_dodge(width=1), aes(noche,edificio3))+
    inset_element(img, 0.8, 0.77, 1, 1)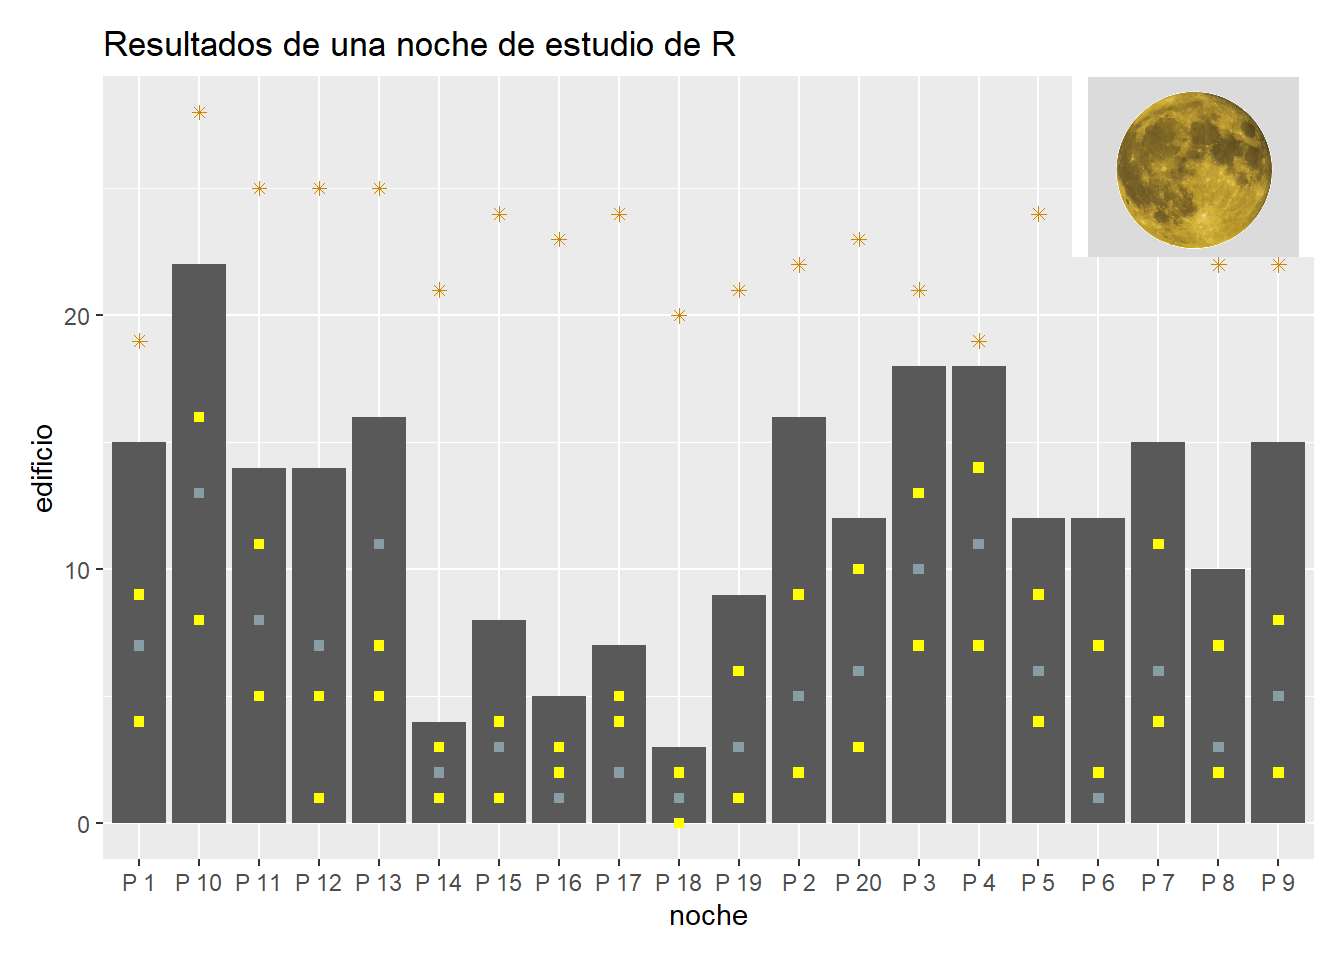
Yamila Albornoz
library (dplyr)
library(modeest)
library(ggplot2)
library(readr)

ggplot(Vinitos, aes(x=1,y=PORCENTAJE, fill=PROVINCIA)) +
  geom_bar(stat="identity") +
  geom_text(aes(label = paste0(round(PORCENTAJE,1),"%")),
            position = position_stack(vjust = 0.5), color="white",size=3) +
  coord_polar(theta = "x") +
  theme_void() +
           labs(title = "Provincia vitivinícola más reseñas",
            subtitle = "Fuente: paquete datos Vinos de Elio",
             caption = "Una donuts dedicada a Yani")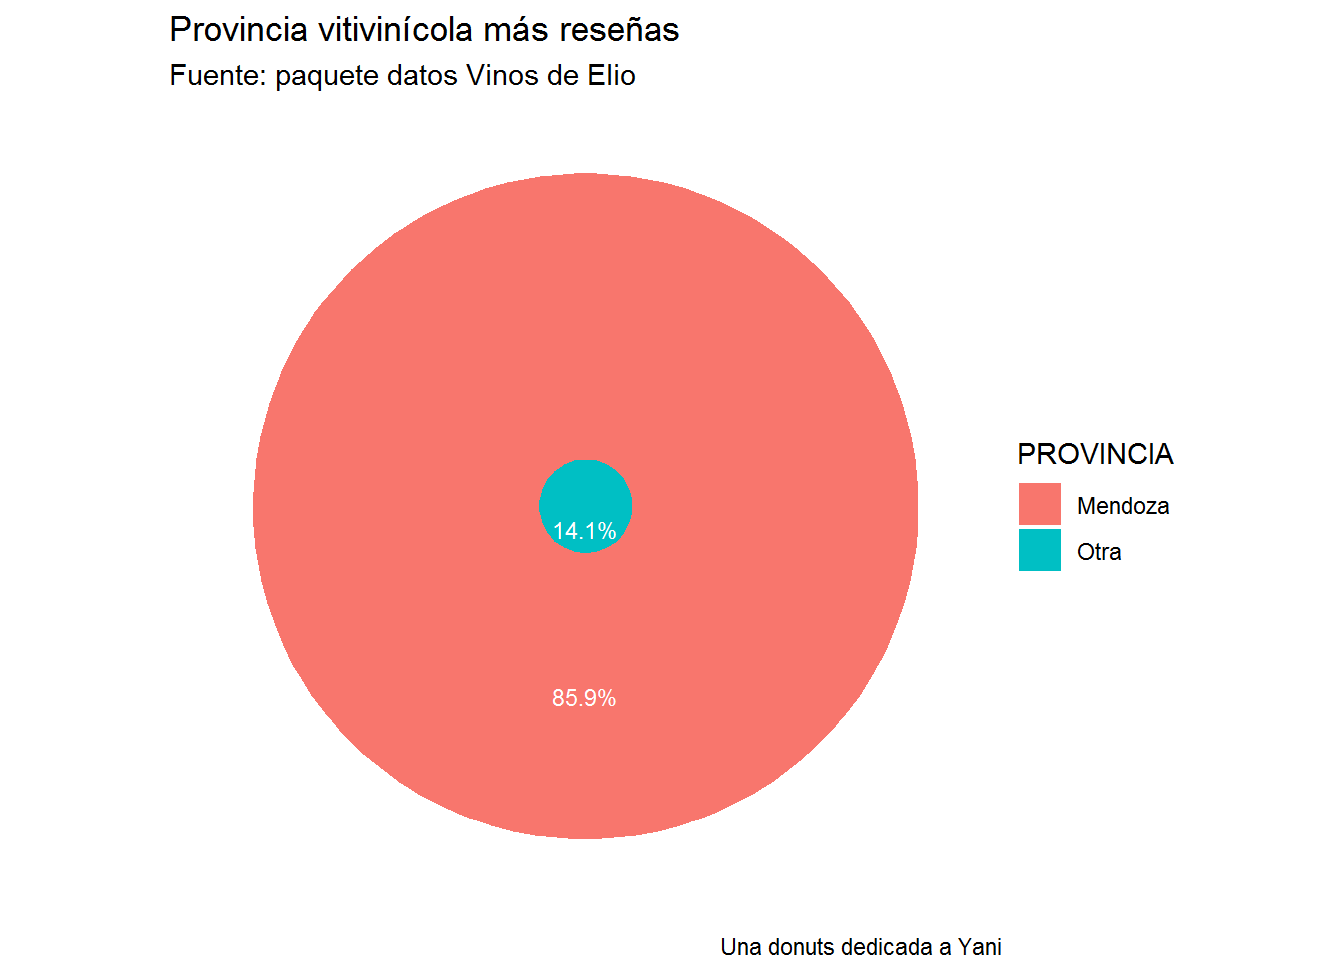
Yanil Hepp
pinguinos <- datos::pinguinos

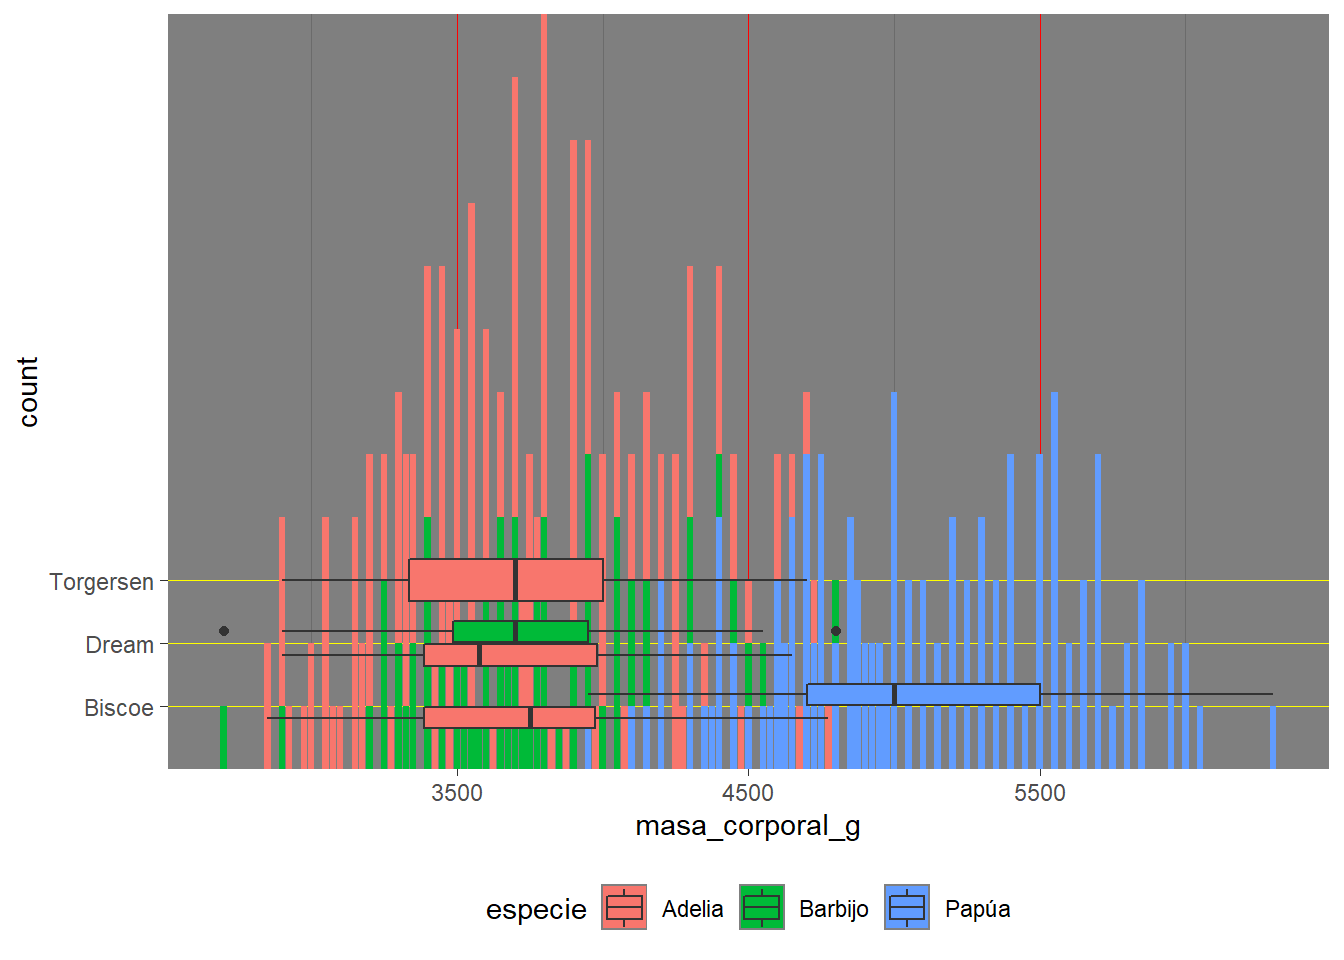
ggplot(pinguinos , aes (x = masa_corporal_g)) + geom_bar(aes(fill = especie)) +
  geom_boxplot(aes(masa_corporal_g, isla, fill= especie))  +  theme_dark() +
  theme(panel.grid.major.y = element_line (color= "yellow")) +
  theme(panel.grid.major.x = element_line (color= "red"))+ theme( legend.position = "bottom")